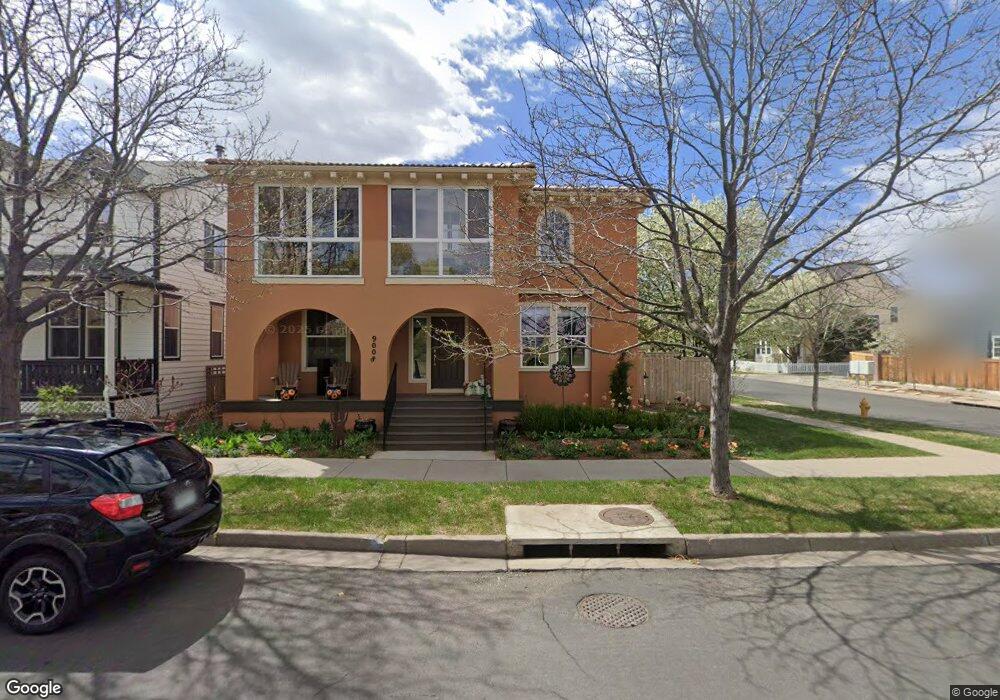
9008 E 25th Dr Denver, CO 80238
Central Park NeighborhoodEstimated Value: $966,058 - $1,145,000
4
Beds
3
Baths
4,039
Sq Ft
$257/Sq Ft
Est. Value
About This Home
This home is located at 9008 E 25th Dr, Denver, CO 80238 and is currently estimated at $1,038,265, approximately $257 per square foot. 9008 E 25th Dr is a home located in Denver County with nearby schools including William (Bill) Roberts ECE-8 School, Westerly Creek Elementary, and Swigert International School.
Ownership History
Date
Name
Owned For
Owner Type
Purchase Details
Closed on
Feb 26, 2009
Sold by
Sorensen Kathleen S and Sorensen Carsten M
Bought by
Klaassen John and Klaassen Kristen
Current Estimated Value
Home Financials for this Owner
Home Financials are based on the most recent Mortgage that was taken out on this home.
Original Mortgage
$417,000
Outstanding Balance
$257,588
Interest Rate
4.92%
Mortgage Type
Purchase Money Mortgage
Estimated Equity
$780,677
Purchase Details
Closed on
Jun 30, 2004
Sold by
Wl Homes Llc
Bought by
Sorensen Carsten M and Sorensen Kathleen S
Home Financials for this Owner
Home Financials are based on the most recent Mortgage that was taken out on this home.
Original Mortgage
$390,875
Interest Rate
5.25%
Mortgage Type
Purchase Money Mortgage
Create a Home Valuation Report for This Property
The Home Valuation Report is an in-depth analysis detailing your home's value as well as a comparison with similar homes in the area
Home Values in the Area
Average Home Value in this Area
Purchase History
| Date | Buyer | Sale Price | Title Company |
|---|---|---|---|
| Klaassen John | $545,000 | Chicago Title Co | |
| Sorensen Carsten M | $488,594 | Land Title Guarantee Company |
Source: Public Records
Mortgage History
| Date | Status | Borrower | Loan Amount |
|---|---|---|---|
| Open | Klaassen John | $417,000 | |
| Previous Owner | Sorensen Carsten M | $390,875 | |
| Closed | Sorensen Carsten M | $48,859 |
Source: Public Records
Tax History
| Year | Tax Paid | Tax Assessment Tax Assessment Total Assessment is a certain percentage of the fair market value that is determined by local assessors to be the total taxable value of land and additions on the property. | Land | Improvement |
|---|---|---|---|---|
| 2025 | $9,630 | $80,320 | $11,550 | $11,550 |
| 2024 | $9,630 | $65,820 | $7,300 | $58,520 |
| 2023 | $9,500 | $65,820 | $7,300 | $58,520 |
| 2022 | $8,633 | $61,090 | $11,390 | $49,700 |
| 2021 | $8,515 | $62,850 | $11,720 | $51,130 |
| 2020 | $7,514 | $56,100 | $11,720 | $44,380 |
| 2019 | $7,401 | $56,100 | $11,720 | $44,380 |
| 2018 | $7,029 | $51,100 | $10,120 | $40,980 |
| 2017 | $7,019 | $51,100 | $10,120 | $40,980 |
| 2016 | $6,295 | $45,470 | $8,382 | $37,088 |
| 2015 | $6,127 | $45,470 | $8,382 | $37,088 |
| 2014 | $5,524 | $39,730 | $7,554 | $32,176 |
Source: Public Records
Map
Nearby Homes
- 9002 E 24th Place Unit 101
- 2521 Alton St
- 8728 E 25th Dr
- 2447 Xanthia St
- 8608 E 25th Dr
- 2362 Xanthia Way
- 2290 Akron Ct Unit 101
- 2320 Central Park Blvd Unit 34
- 2388 N Xanthia Way Unit 102
- 2882 Alton St
- 2872 Alton St
- 2240 Verbana St
- 8461 E 21st Ave
- 9000 Montview Blvd
- 1973 Alton St
- 2222 Valentia St
- 2230 Valentia St
- 1970 Willow St
- 1935 Xenia St
- 9135 E 29th Place Unit B
Your Personal Tour Guide
Ask me questions while you tour the home.