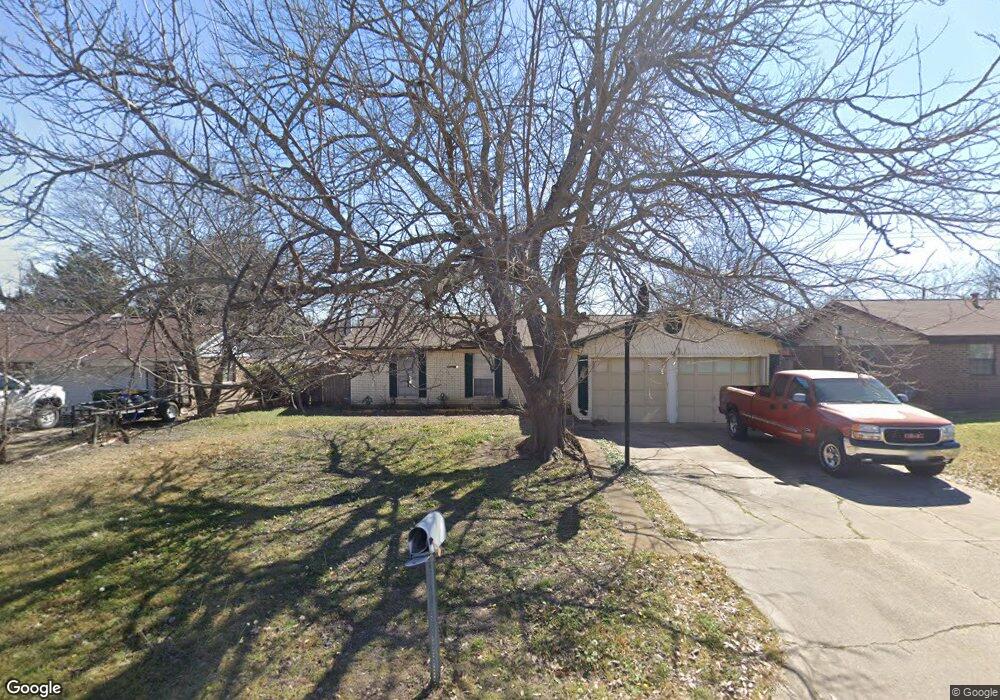
9009 Glenn Dr Fort Worth, TX 76108
Estimated Value: $233,000 - $273,000
3
Beds
2
Baths
1,551
Sq Ft
$162/Sq Ft
Est. Value
About This Home
This home is located at 9009 Glenn Dr, Fort Worth, TX 76108 and is currently estimated at $251,296, approximately $162 per square foot. 9009 Glenn Dr is a home located in Tarrant County with nearby schools including North Elementary School, Brewer Middle School, and Tannahill Intermediate School.
Ownership History
Date
Name
Owned For
Owner Type
Purchase Details
Closed on
Apr 27, 2011
Sold by
The Secretary Of Housing & Urban Develop
Bought by
Rainbolt Terrell
Current Estimated Value
Purchase Details
Closed on
Apr 28, 2010
Sold by
Us Bank National Association
Bought by
The Secretary Of Housing & Urban Develop
Purchase Details
Closed on
Apr 6, 2010
Sold by
Hooten Heidi and Hooten Jeremy
Bought by
Us Bank National Association
Purchase Details
Closed on
Sep 27, 2002
Sold by
Chapman Terry J and Chapman Jearl E
Bought by
Hooten Jeremy and Hooten Heidi
Home Financials for this Owner
Home Financials are based on the most recent Mortgage that was taken out on this home.
Original Mortgage
$87,127
Interest Rate
5.86%
Mortgage Type
FHA
Create a Home Valuation Report for This Property
The Home Valuation Report is an in-depth analysis detailing your home's value as well as a comparison with similar homes in the area
Home Values in the Area
Average Home Value in this Area
Purchase History
| Date | Buyer | Sale Price | Title Company |
|---|---|---|---|
| Rainbolt Terrell | -- | None Available | |
| The Secretary Of Housing & Urban Develop | -- | None Available | |
| Us Bank National Association | $100,417 | None Available | |
| Hooten Jeremy | -- | Blue Star Title |
Source: Public Records
Mortgage History
| Date | Status | Borrower | Loan Amount |
|---|---|---|---|
| Previous Owner | Hooten Jeremy | $87,127 |
Source: Public Records
Tax History Compared to Growth
Tax History
| Year | Tax Paid | Tax Assessment Tax Assessment Total Assessment is a certain percentage of the fair market value that is determined by local assessors to be the total taxable value of land and additions on the property. | Land | Improvement |
|---|---|---|---|---|
| 2025 | $4,856 | $200,000 | $50,734 | $149,266 |
| 2024 | $4,856 | $205,000 | $50,734 | $154,266 |
| 2023 | $4,755 | $200,000 | $50,734 | $149,266 |
| 2022 | $4,546 | $167,851 | $25,000 | $142,851 |
| 2021 | $3,989 | $145,000 | $25,000 | $120,000 |
| 2020 | $4,018 | $145,000 | $25,000 | $120,000 |
| 2019 | $4,171 | $145,000 | $25,000 | $120,000 |
| 2018 | $3,884 | $135,000 | $11,000 | $124,000 |
| 2017 | $3,107 | $106,323 | $11,000 | $95,323 |
| 2016 | $3,107 | $106,323 | $11,000 | $95,323 |
| 2015 | $2,211 | $77,000 | $11,000 | $66,000 |
| 2014 | $2,211 | $91,000 | $11,000 | $80,000 |
Source: Public Records
Map
Nearby Homes
- 9005 Glenn Dr
- 9201 Clifford St
- 8814 Clifford St
- 813 S Kate St
- 627 Hallvale Dr
- 8814 Rockway St
- 8811 Silver Creek Rd
- 204 Lanham Ct
- 308 Hallvale Dr
- 201 N Normandale St
- 304 Lockwood St
- 9104 White Settlement Rd
- 9221 White Settlement Rd
- 8832 Kate St
- 9200 Farmers Rd
- 1800 N Las Vegas Trail
- 8401 Clifford St
- 2640 Wispy Creek Dr
- 2629 Clear Root Cir
- 2625 Clear Root Cir