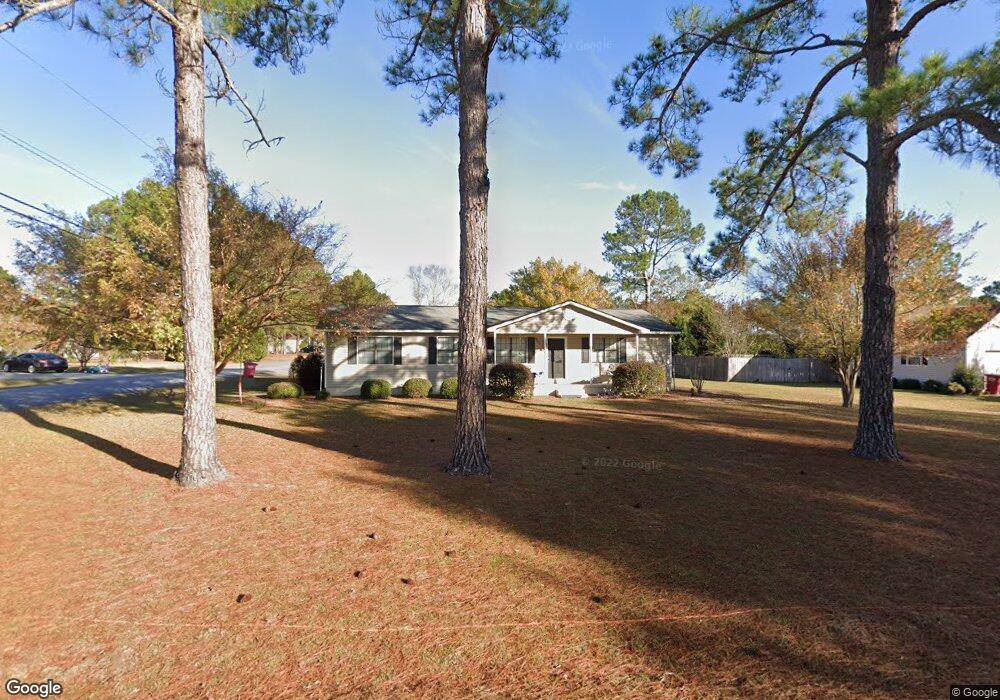
901 42nd St E Tifton, GA 31794
Estimated Value: $210,295 - $244,000
3
Beds
2
Baths
1,456
Sq Ft
$160/Sq Ft
Est. Value
About This Home
This home is located at 901 42nd St E, Tifton, GA 31794 and is currently estimated at $232,765, approximately $159 per square foot. 901 42nd St E is a home located in Tift County with nearby schools including Northside Primary School, Charles Spencer Elementary School, and J.T. Reddick School.
Ownership History
Date
Name
Owned For
Owner Type
Purchase Details
Closed on
Oct 28, 2005
Sold by
Bryan Janet L
Bought by
Nash Michael
Current Estimated Value
Home Financials for this Owner
Home Financials are based on the most recent Mortgage that was taken out on this home.
Original Mortgage
$92,202
Outstanding Balance
$48,383
Interest Rate
5.84%
Mortgage Type
FHA
Estimated Equity
$184,382
Purchase Details
Closed on
Aug 11, 2003
Sold by
Schable Janet L
Bought by
Bryan Richard K
Purchase Details
Closed on
Oct 9, 1996
Sold by
Stokes Michael D and Stokes Teresa D
Bought by
Schable Janet L
Purchase Details
Closed on
May 21, 1993
Sold by
Crozier Kenneth R and Crozier Cheryl
Bought by
Stokes Michael D and Stokes Teresa D
Purchase Details
Closed on
Jul 8, 1992
Sold by
First Family Financial Services
Bought by
Crozier Kenneth R and Crozier Cheryl
Purchase Details
Closed on
Jun 2, 1992
Sold by
Fowler Donnie H and Fowler Mary A
Bought by
First Family Financial Services
Create a Home Valuation Report for This Property
The Home Valuation Report is an in-depth analysis detailing your home's value as well as a comparison with similar homes in the area
Purchase History
| Date | Buyer | Sale Price | Title Company |
|---|---|---|---|
| Nash Michael | $93,650 | -- | |
| Bryan Richard K | -- | -- | |
| Schable Janet L | $70,800 | -- | |
| Stokes Michael D | $59,000 | -- | |
| Crozier Kenneth R | $58,000 | -- | |
| First Family Financial Services | $6,000 | -- |
Source: Public Records
Mortgage History
| Date | Status | Borrower | Loan Amount |
|---|---|---|---|
| Open | Nash Michael | $92,202 |
Source: Public Records
Tax History
| Year | Tax Paid | Tax Assessment Tax Assessment Total Assessment is a certain percentage of the fair market value that is determined by local assessors to be the total taxable value of land and additions on the property. | Land | Improvement |
|---|---|---|---|---|
| 2025 | $1,826 | $65,145 | $10,000 | $55,145 |
| 2024 | $1,826 | $71,574 | $10,000 | $61,574 |
| 2023 | $1,637 | $41,491 | $8,000 | $33,491 |
| 2022 | $1,412 | $41,491 | $8,000 | $33,491 |
| 2021 | $1,421 | $41,491 | $8,000 | $33,491 |
| 2020 | $1,222 | $35,486 | $8,000 | $27,486 |
| 2019 | $1,223 | $35,486 | $8,000 | $27,486 |
| 2018 | $1,223 | $35,486 | $8,000 | $27,486 |
| 2017 | $1,257 | $35,486 | $8,000 | $27,486 |
| 2016 | $1,258 | $35,486 | $8,000 | $27,486 |
| 2015 | $1,260 | $35,486 | $8,000 | $27,486 |
| 2014 | $1,262 | $35,486 | $8,000 | $27,486 |
| 2013 | -- | $35,485 | $8,000 | $27,485 |
Source: Public Records
Map
Nearby Homes
- 909 E 46th St
- 603 40th St E
- 603 48th St
- 346 Somers Ln
- 2612 Goff St
- 2417 Belmont Ave
- 0 Belflower Rd Unit 25624433
- 0 Belflower Rd Unit 139026
- 0 Belflower Rd Unit 24022932
- 0 Belflower Rd Unit 138547
- 0 Belflower Rd Unit 10554704
- 2209 Meadowbrook Dr
- 2014 Tyson Ave
- 2014 Davis Ave
- 2214 Love Ave
- -0- Old Ocilla Rd
- 502 20th St E
- 1809 Davis Ave
- 303 26th St W
- 2605 Murray Ave
- 3608 Carmichael Dr
- 827 42nd St E
- 902 44th St E
- 905 42nd St E
- 4007 Carmichael Dr
- 904 44th St E
- 906 44th St E
- 830 42nd St E
- 830 44th St E
- 823 42nd St E
- 907 42nd St E
- 4005 Carmichael Dr
- 0 Carmichael Dr
- 819 42nd St E
- 822 42nd St E
- 826 44th St E
- 909 42nd St E
- 4003 Carmichael Dr
- 901 44th St E
- 903 44th St E
Your Personal Tour Guide
Ask me questions while you tour the home.