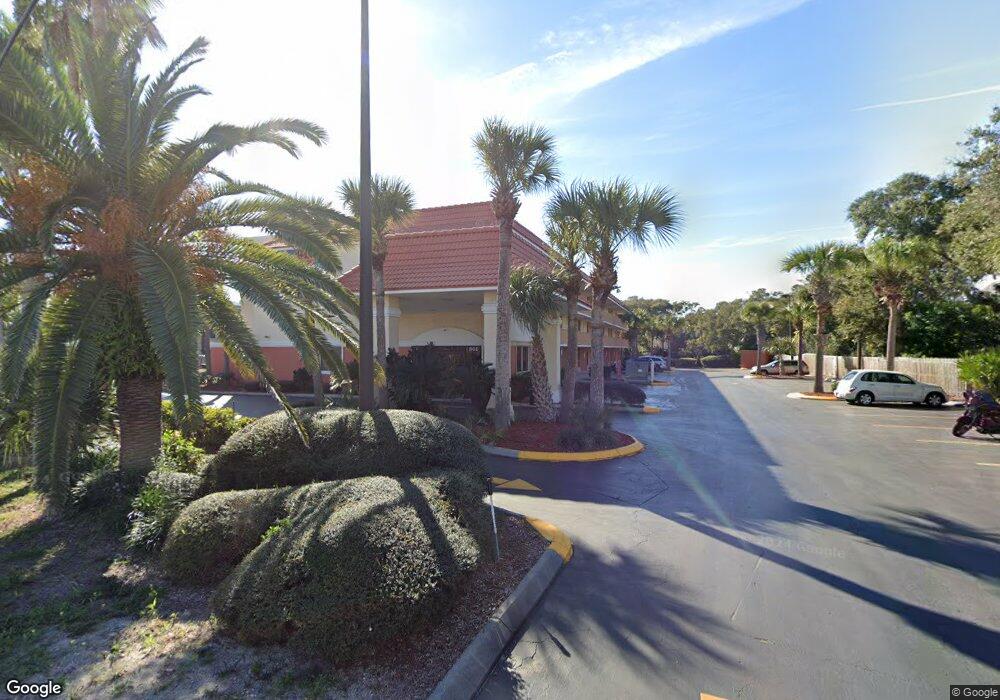
901 A1a Beach Blvd Saint Augustine Beach, FL 32080
Estimated Value: $8,386,897
Studio
--
Bath
27,837
Sq Ft
$301/Sq Ft
Est. Value
About This Home
This home is located at 901 A1a Beach Blvd, Saint Augustine Beach, FL 32080 and is currently estimated at $8,386,897, approximately $301 per square foot. 901 A1a Beach Blvd is a home located in St. Johns County with nearby schools including R.B. Hunt Elementary School, Sebastian Middle School, and St. Augustine High School.
Ownership History
Date
Name
Owned For
Owner Type
Purchase Details
Closed on
Nov 11, 2016
Sold by
Rajaguru Dipakkumae B
Bought by
Michi One Llc
Current Estimated Value
Purchase Details
Closed on
Dec 31, 2015
Sold by
Rajyaguru Dipakkumar B
Bought by
Michi One Llc
Home Financials for this Owner
Home Financials are based on the most recent Mortgage that was taken out on this home.
Original Mortgage
$2,500,000
Interest Rate
3.98%
Mortgage Type
Future Advance Clause Open End Mortgage
Purchase Details
Closed on
Aug 22, 2002
Sold by
Bhaksis Inc
Bought by
Rajyaguru Dipakkumar B
Home Financials for this Owner
Home Financials are based on the most recent Mortgage that was taken out on this home.
Original Mortgage
$980,000
Interest Rate
6.53%
Mortgage Type
Commercial
Create a Home Valuation Report for This Property
The Home Valuation Report is an in-depth analysis detailing your home's value as well as a comparison with similar homes in the area
Home Values in the Area
Average Home Value in this Area
Purchase History
| Date | Buyer | Sale Price | Title Company |
|---|---|---|---|
| Michi One Llc | -- | None Available | |
| Michi One Llc | $4,500,000 | Attorney | |
| Rajyaguru Dipakkumar B | $2,550,000 | -- |
Source: Public Records
Mortgage History
| Date | Status | Borrower | Loan Amount |
|---|---|---|---|
| Previous Owner | Michi One Llc | $2,500,000 | |
| Previous Owner | Rajyaguru Dipakkumar B | $980,000 | |
| Closed | Rajyaguru Dipakkumar B | $1,333,000 |
Source: Public Records
Tax History
| Year | Tax Paid | Tax Assessment Tax Assessment Total Assessment is a certain percentage of the fair market value that is determined by local assessors to be the total taxable value of land and additions on the property. | Land | Improvement |
|---|---|---|---|---|
| 2025 | $43,409 | $2,489,116 | -- | -- |
| 2024 | $43,409 | $4,089,615 | $1,336,500 | $2,753,115 |
| 2023 | $43,409 | $4,166,925 | $1,336,500 | $2,830,425 |
| 2022 | $41,803 | $4,102,700 | $902,138 | $3,200,562 |
| 2021 | $27,487 | $1,700,100 | $0 | $0 |
| 2020 | $32,784 | $2,464,571 | $0 | $0 |
| 2019 | $32,245 | $2,464,800 | $0 | $0 |
| 2018 | $32,982 | $2,768,700 | $0 | $0 |
| 2017 | $33,353 | $2,927,816 | $902,138 | $2,025,678 |
| 2016 | $57,372 | $3,187,231 | $0 | $0 |
| 2015 | $27,391 | $1,505,614 | $0 | $0 |
| 2014 | $24,400 | $1,344,173 | $0 | $0 |
Source: Public Records
Map
Nearby Homes
- 931 A1a Beach Blvd Unit 206
- 931 A1a Beach Blvd Unit 104
- 909 Sandy Beach Cir
- 0 Madrid St Lot 2
- 300 Spanish Oak Ct
- 912 Sandy Beach Cir
- 0 Madrid St Lot 3
- 206 Madrid St
- 473 Ocean Forest Dr
- 123 Whispering Oaks Cir
- 16 Ewing St
- 493 Ocean Forest Dr
- 458 Ocean Forest Dr
- 890 A1a Beach Blvd Unit 62
- 890 A1a Beach Blvd
- 890 A1a Beach Blvd Unit 63
- 890 A1a Beach Blvd Unit 39
- 890 A1a Beach Blvd Unit 31
- 30 Bermuda Run Way
- 9 Bermuda Run Way
- 917 Sandy Beach Cir
- 913 Sandy Beach Cir
- 931 A1a Beach Blvd
- 903 A1a Beach Blvd
- 903 A1a Beach Blvd Unit 202
- 931 A1a Beach Blvd
- 931 A1a Beach Blvd Unit 306
- 931 A1a Beach Blvd Unit 305
- 931 A1a Beach Blvd Unit 304
- 931 A1a Beach Blvd Unit 303
- 931 A1a Beach Blvd Unit 302
- 931 A1a Beach Blvd Unit 301
- 931 A1a Beach Blvd Unit 205
- 931 A1a Beach Blvd Unit 204
- 931 A1a Beach Blvd Unit 203
- 931 A1a Beach Blvd Unit 202
- 931 A1a Beach Blvd Unit 201
- 931 A1a Beach Blvd Unit 106
- 931 A1a Beach Blvd Unit 105
- 931 A1a Beach Blvd Unit 103
Your Personal Tour Guide
Ask me questions while you tour the home.