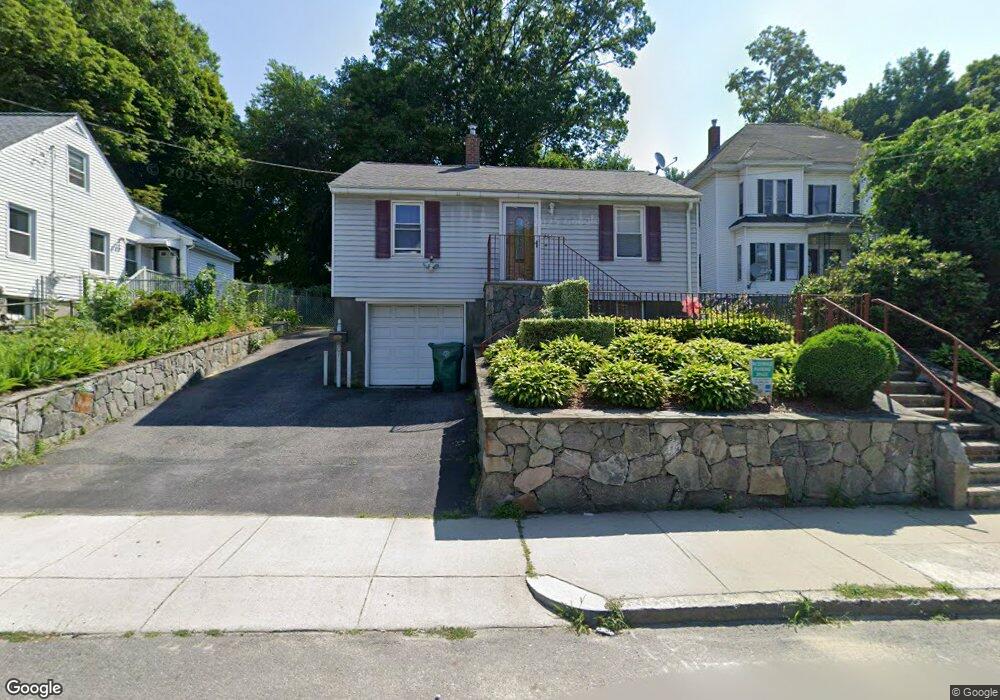
901 Bridge St Lowell, MA 01850
Centralville NeighborhoodEstimated Value: $376,000 - $398,000
2
Beds
1
Bath
744
Sq Ft
$517/Sq Ft
Est. Value
About This Home
This home is located at 901 Bridge St, Lowell, MA 01850 and is currently estimated at $385,011, approximately $517 per square foot. 901 Bridge St is a home located in Middlesex County with nearby schools including S. Christa McAuliffe Elementary School, Greenhalge Elementary School, and Moody Elementary School.
Ownership History
Date
Name
Owned For
Owner Type
Purchase Details
Closed on
Jun 3, 2024
Sold by
Maniatis Petros and Maniatis Lisa
Bought by
Maniatis Rt and Maniatis
Current Estimated Value
Purchase Details
Closed on
Dec 18, 2008
Sold by
Fhlmc
Bought by
Maniatis Lisa and Maniatis Petros
Home Financials for this Owner
Home Financials are based on the most recent Mortgage that was taken out on this home.
Original Mortgage
$70,000
Interest Rate
6.27%
Mortgage Type
Purchase Money Mortgage
Purchase Details
Closed on
Jul 24, 2008
Sold by
Marcil Jason V and First Horizon Home Loa
Bought by
Fhlmc
Purchase Details
Closed on
Dec 30, 2003
Sold by
Reid Charles G
Bought by
Marcil Jason V and Paquette Laura J
Home Financials for this Owner
Home Financials are based on the most recent Mortgage that was taken out on this home.
Original Mortgage
$188,510
Interest Rate
6.01%
Mortgage Type
Purchase Money Mortgage
Create a Home Valuation Report for This Property
The Home Valuation Report is an in-depth analysis detailing your home's value as well as a comparison with similar homes in the area
Home Values in the Area
Average Home Value in this Area
Purchase History
| Date | Buyer | Sale Price | Title Company |
|---|---|---|---|
| Maniatis Rt | -- | None Available | |
| Maniatis Rt | -- | None Available | |
| Maniatis Lisa | $113,000 | -- | |
| Fhlmc | $121,708 | -- | |
| Marcil Jason V | $190,000 | -- | |
| Reid Charles G | -- | -- | |
| Maniatis Lisa | $113,000 | -- | |
| Fhlmc | $121,708 | -- | |
| Marcil Jason V | $190,000 | -- |
Source: Public Records
Mortgage History
| Date | Status | Borrower | Loan Amount |
|---|---|---|---|
| Previous Owner | Maniatis Lisa | $70,000 | |
| Previous Owner | Marcil Jason V | $188,510 | |
| Previous Owner | Marcil Jason V | $35,000 |
Source: Public Records
Tax History Compared to Growth
Tax History
| Year | Tax Paid | Tax Assessment Tax Assessment Total Assessment is a certain percentage of the fair market value that is determined by local assessors to be the total taxable value of land and additions on the property. | Land | Improvement |
|---|---|---|---|---|
| 2025 | $4,176 | $363,800 | $149,700 | $214,100 |
| 2024 | $3,952 | $331,800 | $139,900 | $191,900 |
| 2023 | $3,757 | $302,500 | $121,600 | $180,900 |
| 2022 | $3,250 | $256,100 | $110,600 | $145,500 |
| 2021 | $3,143 | $233,500 | $96,200 | $137,300 |
| 2020 | $2,748 | $205,700 | $84,100 | $121,600 |
| 2019 | $2,645 | $188,400 | $77,900 | $110,500 |
| 2018 | $2,589 | $179,900 | $74,200 | $105,700 |
| 2017 | $2,544 | $170,500 | $67,400 | $103,100 |
| 2016 | $2,435 | $160,600 | $65,800 | $94,800 |
| 2015 | $2,449 | $158,200 | $65,800 | $92,400 |
| 2013 | $2,354 | $156,800 | $76,900 | $79,900 |
Source: Public Records
Map
Nearby Homes
- 891 Bridge St
- 911 Bridge St
- 881 Bridge St
- 42 Wachusett St
- 921 Bridge St
- 50 Wachusett St
- 906 Bridge St
- 14 Wachusett St
- 12 Wachusett St
- 135 Hampshire St
- 56 Wachusett St
- 880 Bridge St
- 880 Bridge St Unit 2
- 89 Bridge Unit 2
- 90-92 Bridge
- 125 Anywhere
- 10 Wachusett St
- 855 Bridge St
- 872 Bridge St
- 872A-B Bridge St