Estimated Value: $135,000 - $161,000
2
Beds
1
Bath
882
Sq Ft
$162/Sq Ft
Est. Value
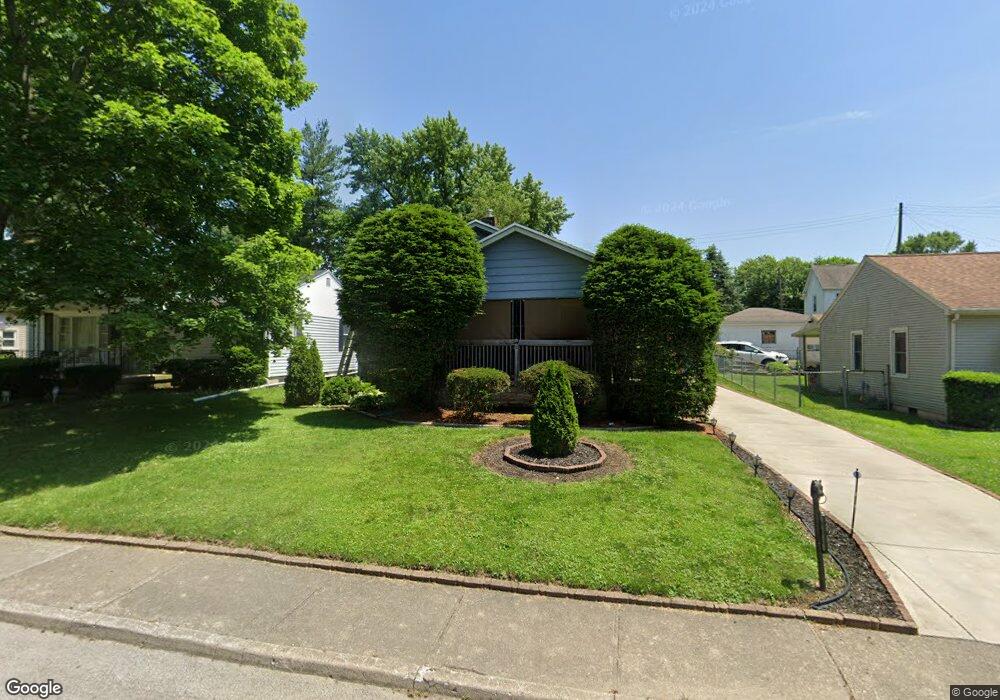
About This Home
This home is located at 901 Catherine St, Xenia, OH 45385 and is currently estimated at $143,255, approximately $162 per square foot. 901 Catherine St is a home located in Greene County with nearby schools including Xenia High School, Summit Academy Community School for Alternative Learners - Xenia, and Legacy Christian Academy.
Ownership History
Date
Name
Owned For
Owner Type
Purchase Details
Closed on
May 8, 2015
Sold by
Ranadall Gilbert Eugene
Bought by
Randall Gene E
Current Estimated Value
Purchase Details
Closed on
Jun 8, 2009
Sold by
Randall Gilbert E and Randall Gilbert Eugene
Bought by
Randall Gilbert Eugene and Randall Marian K
Purchase Details
Closed on
Jun 27, 2003
Sold by
Rockhold Paul A and Rockhold Janette V
Bought by
Randall Gilbert E
Home Financials for this Owner
Home Financials are based on the most recent Mortgage that was taken out on this home.
Original Mortgage
$74,200
Outstanding Balance
$31,784
Interest Rate
5.36%
Mortgage Type
Unknown
Estimated Equity
$111,471
Create a Home Valuation Report for This Property
The Home Valuation Report is an in-depth analysis detailing your home's value as well as a comparison with similar homes in the area
Home Values in the Area
Average Home Value in this Area
Purchase History
| Date | Buyer | Sale Price | Title Company |
|---|---|---|---|
| Randall Gene E | -- | Attorney | |
| Randall Gilbert Eugene | -- | None Available | |
| Randall Gilbert E | $76,500 | -- |
Source: Public Records
Mortgage History
| Date | Status | Borrower | Loan Amount |
|---|---|---|---|
| Open | Randall Gilbert E | $74,200 |
Source: Public Records
Tax History
| Year | Tax Paid | Tax Assessment Tax Assessment Total Assessment is a certain percentage of the fair market value that is determined by local assessors to be the total taxable value of land and additions on the property. | Land | Improvement |
|---|---|---|---|---|
| 2024 | $871 | $30,580 | $4,380 | $26,200 |
| 2023 | $866 | $30,580 | $4,380 | $26,200 |
| 2022 | $709 | $23,240 | $3,500 | $19,740 |
| 2021 | $718 | $23,240 | $3,500 | $19,740 |
| 2020 | $687 | $23,240 | $3,500 | $19,740 |
| 2019 | $682 | $22,280 | $3,620 | $18,660 |
| 2018 | $684 | $22,280 | $3,620 | $18,660 |
| 2017 | $625 | $22,280 | $3,620 | $18,660 |
| 2016 | $626 | $20,890 | $3,620 | $17,270 |
| 2015 | $627 | $20,890 | $3,620 | $17,270 |
| 2014 | $1,033 | $20,890 | $3,620 | $17,270 |
Source: Public Records
Map
Nearby Homes
- 709 N West St
- 878 N Detroit St
- 412 N King St
- 119 Park Dr
- 883 Omard Dr
- 479 N Stadium Dr
- 244 Edison Blvd
- 513 Redbud Ln
- 603 Louise Dr
- 610 Saxony Dr
- 505 S Stadium Dr
- 289 Hollywood Blvd
- 1790 Palmer Ct
- 1796 Palmer Ct
- 493 Hollywood Blvd
- 454 E Church St
- 1808 Palmer Ct
- 167 Beverly Place
- Harmony Plan at Grandstone Trace
- Newcastle Plan at Grandstone Trace
- 911 Catherine St
- 921 Catherine St
- 881 Catherine St
- 852 Florence St
- 860 Florence St
- 872 Florence St
- 873 Catherine St
- 908 Catherine St
- 908 Catherine St
- 113 W Harbine Ave
- 830 Florence St
- 830 Florence St
- 918 Catherine St
- 888 Catherine St
- 880 Catherine St
- 880 Florence St
- 870 Catherine St
- 932 Catherine St
- 212 W Ankeney Mill Rd
- 190 W Ankeney Mill Rd
Your Personal Tour Guide
Ask me questions while you tour the home.