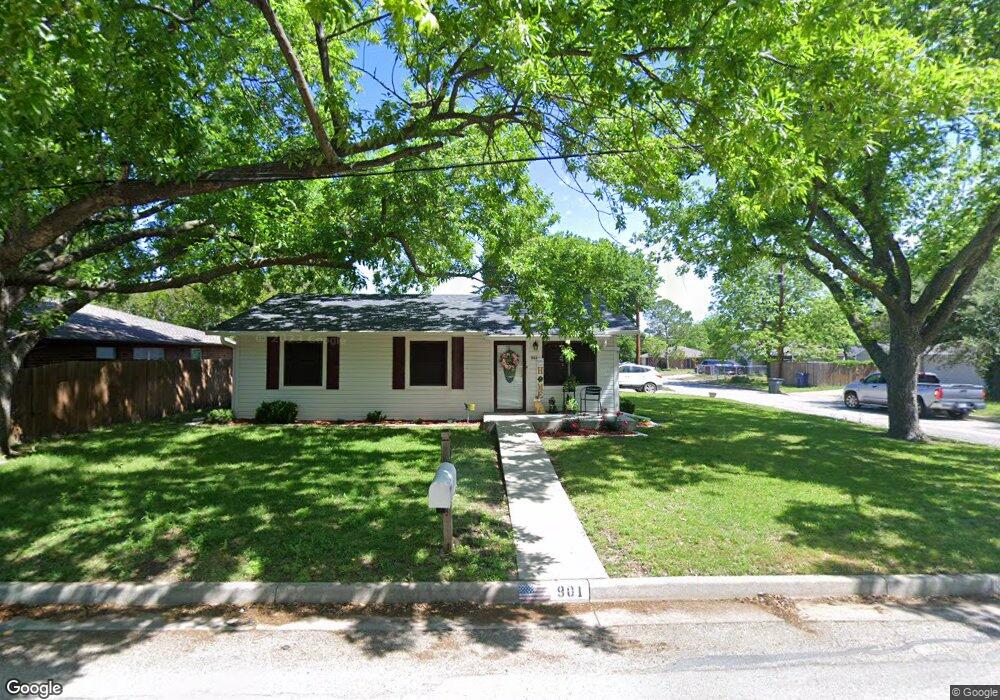
901 Church St Sanger, TX 76266
Estimated Value: $220,870 - $249,000
--
Bed
--
Bath
972
Sq Ft
$239/Sq Ft
Est. Value
About This Home
This home is located at 901 Church St, Sanger, TX 76266 and is currently estimated at $232,468, approximately $239 per square foot. 901 Church St is a home located in Denton County with nearby schools including Chisholm Trail Elementary School, Clear Creek Intermediate School, and Sanger Sixth Grade Campus.
Create a Home Valuation Report for This Property
The Home Valuation Report is an in-depth analysis detailing your home's value as well as a comparison with similar homes in the area
Home Values in the Area
Average Home Value in this Area
Tax History Compared to Growth
Tax History
| Year | Tax Paid | Tax Assessment Tax Assessment Total Assessment is a certain percentage of the fair market value that is determined by local assessors to be the total taxable value of land and additions on the property. | Land | Improvement |
|---|---|---|---|---|
| 2025 | $1,103 | $190,069 | $63,788 | $177,459 |
| 2024 | $3,492 | $172,790 | $0 | $0 |
| 2023 | $994 | $157,082 | $49,613 | $136,512 |
| 2022 | $3,167 | $142,802 | $39,463 | $187,124 |
| 2021 | $2,728 | $195,141 | $32,288 | $162,853 |
| 2020 | $2,611 | $118,017 | $32,288 | $126,321 |
| 2019 | $2,443 | $107,289 | $32,288 | $129,513 |
| 2018 | $2,233 | $97,535 | $32,288 | $111,102 |
| 2017 | $2,039 | $88,668 | $32,288 | $79,502 |
| 2016 | $766 | $80,607 | $17,938 | $73,148 |
| 2015 | $705 | $73,279 | $17,938 | $64,412 |
| 2013 | -- | $60,561 | $17,938 | $42,623 |
Source: Public Records
Map
Nearby Homes
- 710 W Willow St
- 509 Marshall St
- 505 Houston St
- 109 Colonial Heights
- 113 Diane Dr
- 109 S 5th St
- 319 Austin St
- 1010 Bolivar St
- 411 Hughes St
- 212 Diane Dr
- 1209 Bolivar St
- 226 Hillcrest St
- 702 Peach St Unit 2
- 902 Plum St
- 612 N 10th St
- 106 W Holt St
- 185 Aster Dr
- TBD Interstate 35
- 202 Southland Dr
- 124 Morning Glory