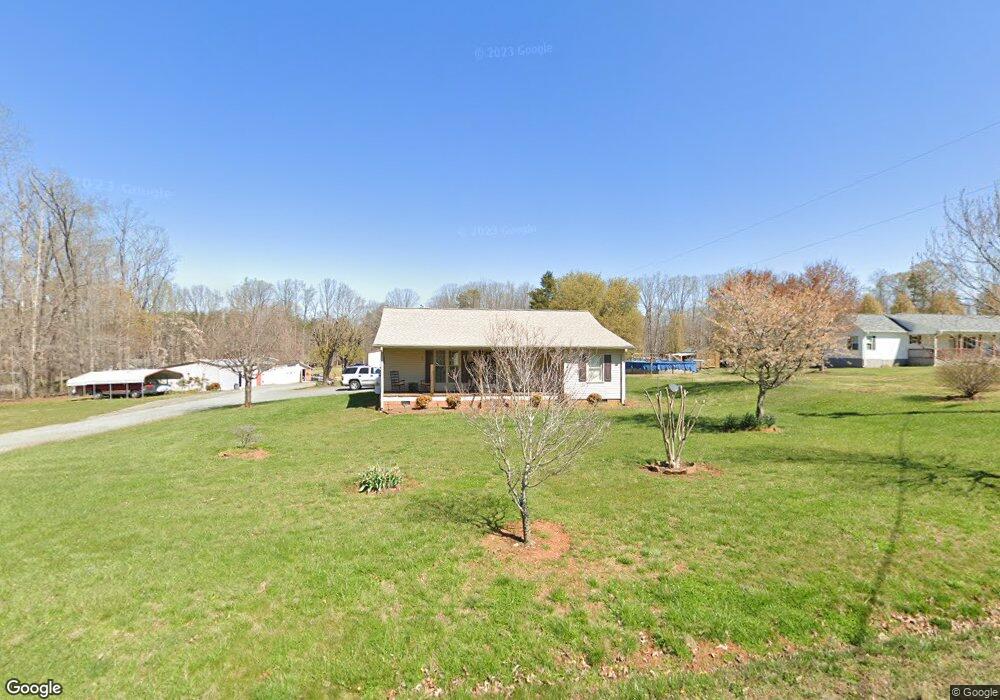
901 County Line Rd Reidsville, NC 27320
Estimated Value: $258,000 - $345,000
--
Bed
1
Bath
1,320
Sq Ft
$224/Sq Ft
Est. Value
About This Home
This home is located at 901 County Line Rd, Reidsville, NC 27320 and is currently estimated at $295,246, approximately $223 per square foot. 901 County Line Rd is a home located in Rockingham County with nearby schools including Williamsburg Elementary School, Reidsville High School, and Reidsville Middle School.
Ownership History
Date
Name
Owned For
Owner Type
Purchase Details
Closed on
Mar 7, 2022
Sold by
Lee Groff Iii Robert and Lee Teresa H
Bought by
Lovelace Susan Darlene Hank
Current Estimated Value
Home Financials for this Owner
Home Financials are based on the most recent Mortgage that was taken out on this home.
Original Mortgage
$65,656
Outstanding Balance
$61,183
Interest Rate
3.69%
Mortgage Type
New Conventional
Estimated Equity
$234,063
Purchase Details
Closed on
Jan 17, 2016
Sold by
Lovelace John I and Lovelace Susan T
Bought by
Chilton Tanya L and Chilton Jason T
Purchase Details
Closed on
Apr 28, 2014
Sold by
Lovelace John I and Lovelace Susan T
Bought by
Lovelace Carlton K and Lovelace Shawna H
Home Financials for this Owner
Home Financials are based on the most recent Mortgage that was taken out on this home.
Original Mortgage
$30,000
Interest Rate
3.89%
Mortgage Type
Seller Take Back
Create a Home Valuation Report for This Property
The Home Valuation Report is an in-depth analysis detailing your home's value as well as a comparison with similar homes in the area
Home Values in the Area
Average Home Value in this Area
Purchase History
| Date | Buyer | Sale Price | Title Company |
|---|---|---|---|
| Lovelace Susan Darlene Hank | $65,000 | Chicago Title | |
| Chilton Tanya L | -- | None Available | |
| Lovelace Carlton K | $7,500 | Attorney |
Source: Public Records
Mortgage History
| Date | Status | Borrower | Loan Amount |
|---|---|---|---|
| Open | Lovelace Susan Darlene Hank | $65,656 | |
| Previous Owner | Lovelace Carlton K | $30,000 |
Source: Public Records
Tax History Compared to Growth
Tax History
| Year | Tax Paid | Tax Assessment Tax Assessment Total Assessment is a certain percentage of the fair market value that is determined by local assessors to be the total taxable value of land and additions on the property. | Land | Improvement |
|---|---|---|---|---|
| 2025 | $1,547 | $326,261 | $57,072 | $269,189 |
| 2024 | $1,527 | $326,261 | $57,072 | $269,189 |
| 2023 | $1,527 | $196,045 | $29,725 | $166,320 |
| 2022 | $1,578 | $196,045 | $29,725 | $166,320 |
| 2021 | $1,578 | $196,045 | $29,725 | $166,320 |
| 2020 | $1,578 | $196,045 | $29,725 | $166,320 |
| 2019 | $1,578 | $196,045 | $29,725 | $166,320 |
| 2018 | $1,463 | $181,555 | $36,752 | $144,803 |
| 2017 | $1,492 | $181,555 | $36,752 | $144,803 |
| 2015 | $995 | $122,252 | $46,752 | $75,500 |
| 2014 | $985 | $122,252 | $46,752 | $75,500 |
Source: Public Records
Map
Nearby Homes
- 251 MacY Mae Way
- 319 MacY Mae Way
- 475 Parkdale Rd
- 552 Nc Highway 87
- 0000 Neal Rd
- 000 Neal Rd
- 276 Brann Rd
- 341 Somers Loop
- 10064 Cherry Grove Rd
- 14.45± Acres Off Pritchett Rd
- 000 Sunset View Ct
- 198 Antler Ct
- 2004 Camp Springs Rd
- 1152 Pagetown Rd
- 7238 Abb Rd
- 4100 High Rock Rd
- 0 Candy Creek Rd
- 11741 N Carolina 150
- 0 Jones Lake Rd
- 336 Jones Lake Rd
- 880 County Line Rd
- 920 County Line Rd
- 870 County Line Rd
- 152 Lovelace Ln
- 937 County Line Rd
- 854 County Line Rd
- 0 County Line Rd
- 00 County Line Rd
- 995 County Line Rd
- 848 County Line Rd
- 1006 County Line Rd
- 711 County Line Rd
- 681 County Line Rd
- 1130 County Line Rd
- 179 Zeb Rd
- 726 County Line Rd
- 661 County Line Rd
- 657 County Line Rd
- 621 County Line Rd
- 644 County Line Rd