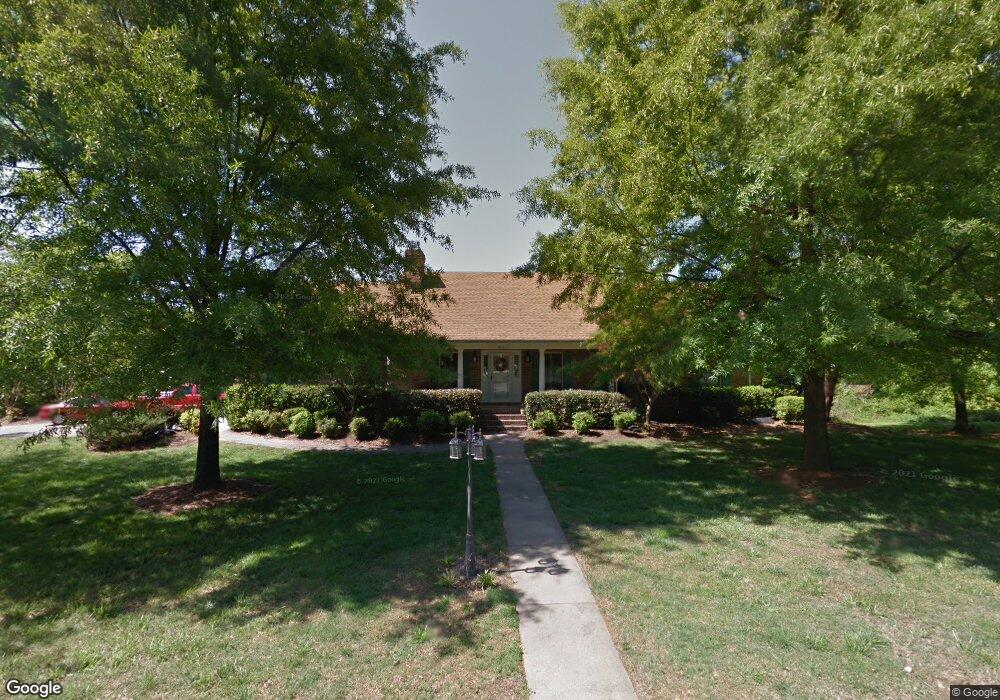
901 Crescent Cir Kings Mountain, NC 28086
Estimated Value: $339,000 - $488,000
3
Beds
3
Baths
2,980
Sq Ft
$140/Sq Ft
Est. Value
About This Home
This home is located at 901 Crescent Cir, Kings Mountain, NC 28086 and is currently estimated at $415,777, approximately $139 per square foot. 901 Crescent Cir is a home located in Cleveland County with nearby schools including West Elementary School, Kings Mountain Middle, and Kings Mountain Intermediate School.
Ownership History
Date
Name
Owned For
Owner Type
Purchase Details
Closed on
Jun 28, 2011
Sold by
Grimsley Pamela T
Bought by
Mccomas Gregory Brandon and Mccomas Charity R
Current Estimated Value
Home Financials for this Owner
Home Financials are based on the most recent Mortgage that was taken out on this home.
Original Mortgage
$271,950
Interest Rate
4.63%
Mortgage Type
Seller Take Back
Purchase Details
Closed on
May 19, 2009
Sold by
Casler Gregory S and Casler Melissa E
Bought by
Grimsley Pamela T
Home Financials for this Owner
Home Financials are based on the most recent Mortgage that was taken out on this home.
Original Mortgage
$125,000
Interest Rate
4.89%
Mortgage Type
Credit Line Revolving
Purchase Details
Closed on
May 15, 2007
Sold by
Grimsley Pamela T
Bought by
Casler Gregory S
Home Financials for this Owner
Home Financials are based on the most recent Mortgage that was taken out on this home.
Original Mortgage
$97,560
Interest Rate
6.12%
Mortgage Type
New Conventional
Create a Home Valuation Report for This Property
The Home Valuation Report is an in-depth analysis detailing your home's value as well as a comparison with similar homes in the area
Home Values in the Area
Average Home Value in this Area
Purchase History
| Date | Buyer | Sale Price | Title Company |
|---|---|---|---|
| Mccomas Gregory Brandon | $273,000 | None Available | |
| Grimsley Pamela T | $240,000 | None Available | |
| Casler Gregory S | $227,500 | None Available |
Source: Public Records
Mortgage History
| Date | Status | Borrower | Loan Amount |
|---|---|---|---|
| Closed | Mccomas Gregory Brandon | $271,950 | |
| Previous Owner | Grimsley Pamela T | $125,000 | |
| Previous Owner | Casler Gregory S | $97,560 |
Source: Public Records
Tax History Compared to Growth
Tax History
| Year | Tax Paid | Tax Assessment Tax Assessment Total Assessment is a certain percentage of the fair market value that is determined by local assessors to be the total taxable value of land and additions on the property. | Land | Improvement |
|---|---|---|---|---|
| 2025 | $3,636 | $354,747 | $44,739 | $310,008 |
| 2024 | $3,645 | $310,038 | $40,265 | $269,773 |
| 2023 | $3,490 | $310,038 | $40,265 | $269,773 |
| 2022 | $3,472 | $310,038 | $40,265 | $269,773 |
| 2021 | $3,490 | $310,038 | $40,265 | $269,773 |
| 2020 | $2,616 | $225,544 | $34,000 | $191,544 |
| 2019 | $2,616 | $225,544 | $34,000 | $191,544 |
| 2018 | $2,615 | $225,544 | $34,000 | $191,544 |
| 2017 | $2,602 | $225,544 | $34,000 | $191,544 |
| 2016 | $2,612 | $225,544 | $34,000 | $191,544 |
| 2015 | $2,349 | $208,075 | $28,632 | $179,443 |
| 2014 | $2,349 | $208,075 | $28,632 | $179,443 |
Source: Public Records
Map
Nearby Homes
- 811 W Gold St Unit 26
- 400 S Cansler St
- 316 S Cansler St
- 411 S Battleground Ave
- 417 Phifer Rd
- 442 Phifer Rd
- 106 N Tracy St
- 300 N Watterson St
- 112 Fulton Dr
- 208 Victoria Cir
- 200 E Gold St
- 430 Fulton Dr
- 310 Campbell Cir
- 1301 Shelby Rd
- 804 Lee St
- 207 Morris St
- 110 N Gaston St
- 117 Parker Claire Ln
- 111 Parker Claire Ln
- 213 Parker Claire Ln
- 415 Hawthorne Rd
- 701 Marion St
- 903 Crescent Cir
- 602 Marion St
- 200 Oakland St
- 0 Oakland St
- 501 Hawthorne Rd
- 411 Hawthorne Rd
- 700 Marion St
- 703 Marion St
- 803 Crescent Cir
- 902 Crescent Cir
- 905 Crescent Cir
- 503 Hawthorne Rd
- 409 Hawthorne Rd
- 702 Marion St
- 502 Hawthorne Rd
- 500 Hawthorne Rd
- 611 Hillside Dr
- 414 Hawthorne Rd