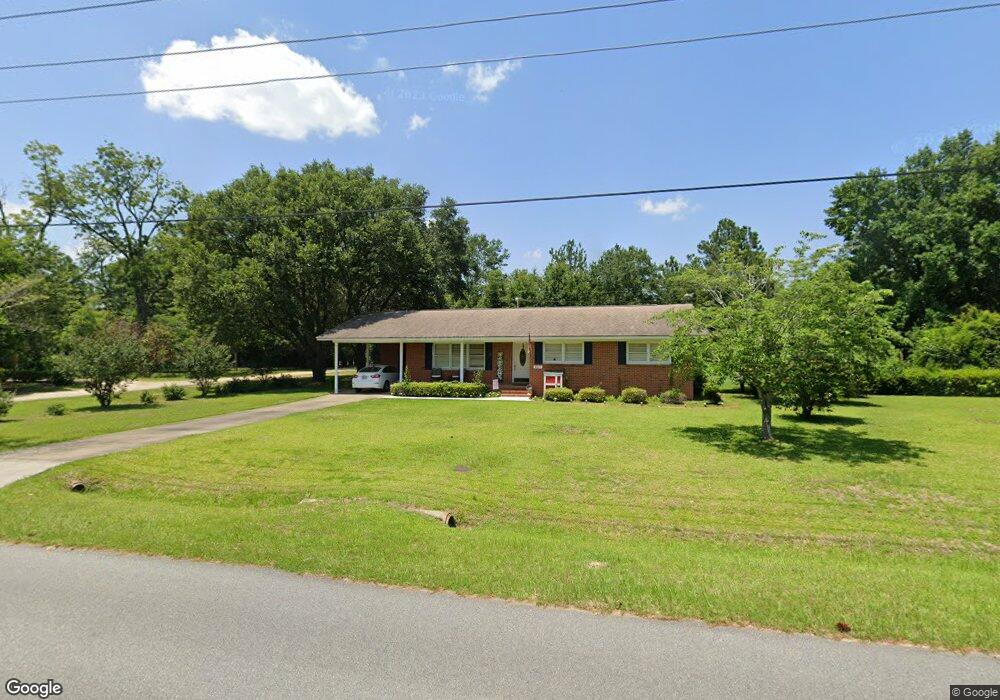
901 E 3rd Ave Cordele, GA 31015
Estimated Value: $158,008 - $187,000
3
Beds
2
Baths
1,648
Sq Ft
$106/Sq Ft
Est. Value
About This Home
This home is located at 901 E 3rd Ave, Cordele, GA 31015 and is currently estimated at $174,752, approximately $106 per square foot. 901 E 3rd Ave is a home located in Crisp County with nearby schools including Crisp County Elementary School, Crisp County Primary School, and Crisp County Middle School.
Ownership History
Date
Name
Owned For
Owner Type
Purchase Details
Closed on
May 1, 2023
Sold by
Acosta Tibisay Gonzalez
Bought by
Delgado Gabriela
Current Estimated Value
Purchase Details
Closed on
Jul 22, 2019
Sold by
Acosta Roger
Bought by
Acosta Roger and Acosta Tibisay Lucia Gonzalez
Purchase Details
Closed on
Sep 12, 2006
Sold by
Owens Kay B
Bought by
Satterfield Mary A
Home Financials for this Owner
Home Financials are based on the most recent Mortgage that was taken out on this home.
Original Mortgage
$107,046
Interest Rate
6.48%
Mortgage Type
New Conventional
Purchase Details
Closed on
Nov 23, 1998
Sold by
Stephens Linda B
Bought by
Bennett Kay B
Purchase Details
Closed on
May 21, 1982
Bought by
Stepens Linda and Stepens Kay
Purchase Details
Closed on
Nov 11, 1963
Sold by
Stepens Linda and Stepens Kay
Bought by
Bowen James H
Create a Home Valuation Report for This Property
The Home Valuation Report is an in-depth analysis detailing your home's value as well as a comparison with similar homes in the area
Purchase History
| Date | Buyer | Sale Price | Title Company |
|---|---|---|---|
| Delgado Gabriela | -- | -- | |
| Acosta Roger | -- | -- | |
| Acosta Roger | $108,000 | -- | |
| Satterfield Mary A | $105,000 | -- | |
| Bennett Kay B | -- | -- | |
| Stepens Linda | -- | -- | |
| Bowen James H | -- | -- |
Source: Public Records
Mortgage History
| Date | Status | Borrower | Loan Amount |
|---|---|---|---|
| Previous Owner | Satterfield Mary A | $107,046 |
Source: Public Records
Tax History
| Year | Tax Paid | Tax Assessment Tax Assessment Total Assessment is a certain percentage of the fair market value that is determined by local assessors to be the total taxable value of land and additions on the property. | Land | Improvement |
|---|---|---|---|---|
| 2025 | $1,581 | $57,746 | $6,144 | $51,602 |
| 2024 | $1,472 | $52,607 | $6,144 | $46,463 |
| 2023 | $1,321 | $46,965 | $3,072 | $43,893 |
| 2022 | $756 | $44,396 | $3,072 | $41,324 |
| 2021 | $741 | $41,826 | $3,072 | $38,754 |
| 2020 | $730 | $41,826 | $3,072 | $38,754 |
| 2019 | $735 | $41,826 | $3,072 | $38,754 |
| 2018 | $480 | $32,194 | $4,608 | $27,586 |
| 2017 | $1,307 | $32,194 | $4,608 | $27,586 |
| 2016 | $482 | $32,194 | $4,608 | $27,586 |
| 2015 | -- | $32,194 | $4,608 | $27,586 |
| 2014 | -- | $32,194 | $4,608 | $27,586 |
| 2013 | -- | $32,194 | $4,608 | $27,586 |
Source: Public Records
Map
Nearby Homes
- 824 E 3rd Ave
- 703 N Pecan St
- 405 N Bay St
- 1102 N 3rd St
- 413 E 2nd Ave
- 612 E 12th Ave
- 807 E 14th Ave
- 812 E 14th Ave
- 511 E 13th Ave
- 315 E 12th Ave
- 2413 S Ga 41 Hwy
- 715 E 17th Ave
- 312 E 14th Ave
- 709 Fleming Rd
- 716 E 18th Ave
- 1002 Camellia Dr
- 316 E 18th Ave
- 720 E 20th Ave
- 1012 E 21st Ave
- 1509 E 20th Ave
Your Personal Tour Guide
Ask me questions while you tour the home.