901 E High St Mount Gilead, OH 43338
Estimated Value: $824,000 - $2,377,000
2
Beds
2
Baths
5,610
Sq Ft
$316/Sq Ft
Est. Value
About This Home
This home is located at 901 E High St, Mount Gilead, OH 43338 and is currently estimated at $1,773,346, approximately $316 per square foot. 901 E High St is a home located in Morrow County with nearby schools including Park Avenue Elementary School, Mt Gilead Middle School, and Mt Gilead High School.
Ownership History
Date
Name
Owned For
Owner Type
Purchase Details
Closed on
Apr 20, 2023
Sold by
Autumn Lakes Family Campground Ltd
Bought by
Autumn Lakes Family Campground Ltd
Current Estimated Value
Purchase Details
Closed on
Mar 21, 2019
Sold by
Pine Lakes Golf Club Vtm
Bought by
4Ko Llc
Home Financials for this Owner
Home Financials are based on the most recent Mortgage that was taken out on this home.
Original Mortgage
$2,000,000
Interest Rate
4.4%
Mortgage Type
Purchase Money Mortgage
Purchase Details
Closed on
Mar 24, 2017
Sold by
Pine Lakes Golf Club
Bought by
Pine Lakes Golf Club Vtm
Purchase Details
Closed on
Oct 30, 2007
Bought by
Pine Lakes Golf Club Mt Gilead Ohio Llc
Purchase Details
Closed on
Sep 25, 2007
Sold by
Pine Lakes Golf Course
Bought by
Ccc Real Estate Holdings Llc
Purchase Details
Closed on
Apr 16, 1998
Bought by
Pine Lakes Golf Course
Create a Home Valuation Report for This Property
The Home Valuation Report is an in-depth analysis detailing your home's value as well as a comparison with similar homes in the area
Home Values in the Area
Average Home Value in this Area
Purchase History
| Date | Buyer | Sale Price | Title Company |
|---|---|---|---|
| Autumn Lakes Family Campground Ltd | -- | -- | |
| 4Ko Llc | $1,250,000 | -- | |
| Pine Lakes Golf Club Vtm | $525,000 | -- | |
| Pine Lakes Golf Club Mt Gilead Ohio Llc | -- | -- | |
| Ccc Real Estate Holdings Llc | $690,000 | -- | |
| Pine Lakes Golf Course | -- | -- |
Source: Public Records
Mortgage History
| Date | Status | Borrower | Loan Amount |
|---|---|---|---|
| Previous Owner | 4Ko Llc | $2,000,000 |
Source: Public Records
Tax History
| Year | Tax Paid | Tax Assessment Tax Assessment Total Assessment is a certain percentage of the fair market value that is determined by local assessors to be the total taxable value of land and additions on the property. | Land | Improvement |
|---|---|---|---|---|
| 2025 | $30,957 | $682,410 | $331,170 | $351,240 |
| 2024 | $33,673 | $656,320 | $331,170 | $325,150 |
| 2023 | $33,673 | $656,320 | $331,170 | $325,150 |
| 2022 | $21,853 | $388,190 | $187,040 | $201,150 |
| 2021 | $22,023 | $382,590 | $187,040 | $195,550 |
| 2020 | $15,448 | $282,110 | $140,180 | $141,930 |
| 2019 | $15,129 | $282,110 | $140,180 | $141,930 |
| 2018 | $14,947 | $282,110 | $140,180 | $141,930 |
| 2017 | $14,951 | $282,110 | $140,180 | $141,930 |
| 2016 | $13,437 | $241,150 | $124,390 | $116,760 |
| 2015 | $13,011 | $241,150 | $124,390 | $116,760 |
| 2014 | $20,407 | $377,860 | $134,190 | $243,670 |
| 2013 | $19,368 | $377,860 | $134,190 | $243,670 |
Source: Public Records
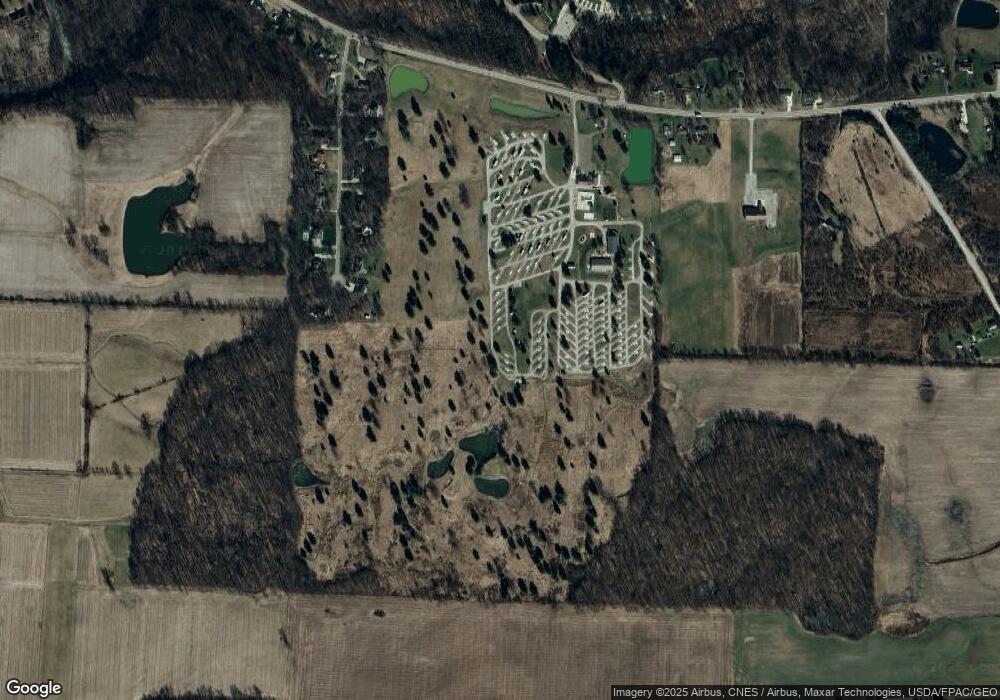
Map
Nearby Homes
- 4350 Township Road 110
- 5280 Township Road 103
- 4926 U S Highway 42
- 5537 US Highway 42
- 250 S Main St
- 4739 Township Road 111
- 5555 U S 42
- 148 N Walnut St
- 52 N Main St
- 85 S Cherry St
- 4663 Township Road 112
- 202 Iberia St
- 0 Tamarack Unit 223034150
- 0 Iberia St
- 251 Lincoln Ave
- 329 W High St
- 473 N Delaware St
- 618 Grant St
- 4449 County Road 114
- 614 Buckeye Ln
- 4394 State Route 95
- 4394 State Route 95
- 4408 State Route 95
- 661 E High St
- 4418 State Route 95
- 4409 Ohio 95
- 4409 State Route 95
- 4417 State Route 95
- 4433 State Route 95
- 160 Fairway Ln
- 4433 Ohio 95
- 150 Fairway Ln
- 140 Fairway Ln
- 130 Fairway Ln
- 4465 State Route 95
- 120 Fairway Ln
- 4473 State Route 95
- 4119 Ohio 95
- 100 Fairway Ln
- 0 Fairway Ln
Your Personal Tour Guide
Ask me questions while you tour the home.