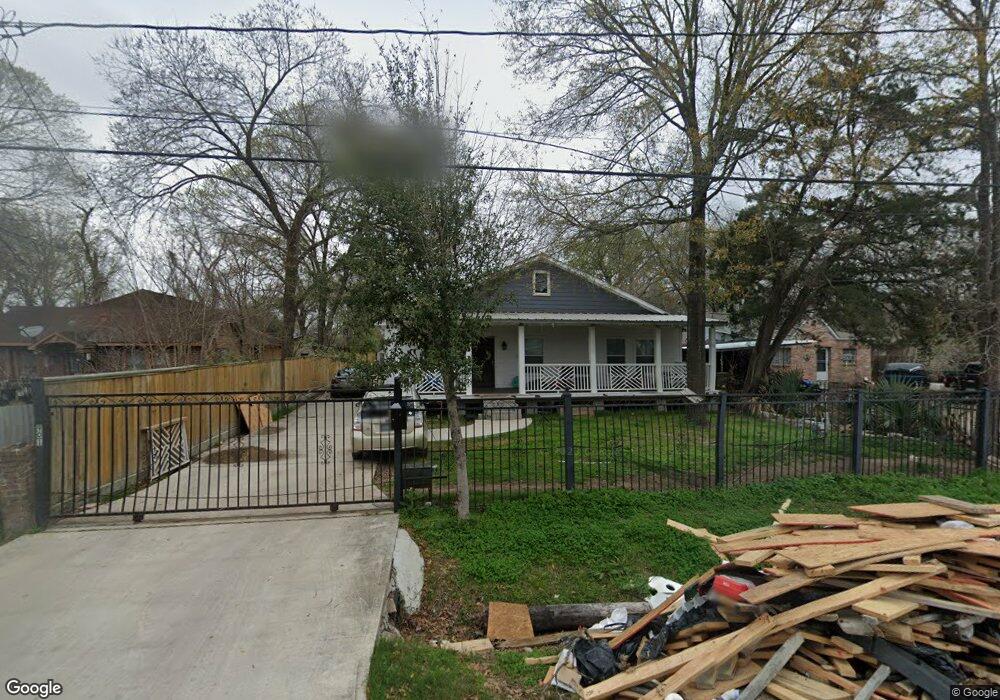
901 Eubanks St Houston, TX 77022
Northside-Northline NeighborhoodEstimated Value: $359,429 - $426,000
3
Beds
2
Baths
2,843
Sq Ft
$137/Sq Ft
Est. Value
About This Home
This home is located at 901 Eubanks St, Houston, TX 77022 and is currently estimated at $390,607, approximately $137 per square foot. 901 Eubanks St is a home located in Harris County with nearby schools including Janowski Elementary School, Burbank Middle School, and Sam Houston Math, Science & Technology Center.
Ownership History
Date
Name
Owned For
Owner Type
Purchase Details
Closed on
Feb 9, 2015
Sold by
Padilla Jose Roberto
Bought by
Gonzalez Brittany
Current Estimated Value
Purchase Details
Closed on
Jul 1, 2014
Sold by
Cooper Laura Lee and Cooper Larry Edward
Bought by
Padilla Jose Roberto
Purchase Details
Closed on
Jul 1, 2005
Sold by
Cooper Thomas E and Cooper Ruth D
Bought by
Padilla Jose Roberto
Home Financials for this Owner
Home Financials are based on the most recent Mortgage that was taken out on this home.
Original Mortgage
$41,000
Interest Rate
5.61%
Mortgage Type
Seller Take Back
Purchase Details
Closed on
Oct 2, 2002
Sold by
Orosco James and Orosco Margaret
Bought by
Cooper Thomas E and Cooper Ruth D
Purchase Details
Closed on
Jun 18, 2001
Sold by
Cooper Rebecca Diane
Bought by
Cooper Thomas E and Cooper Ruth D
Create a Home Valuation Report for This Property
The Home Valuation Report is an in-depth analysis detailing your home's value as well as a comparison with similar homes in the area
Home Values in the Area
Average Home Value in this Area
Purchase History
| Date | Buyer | Sale Price | Title Company |
|---|---|---|---|
| Gonzalez Brittany | -- | None Available | |
| Padilla Jose Roberto | -- | None Available | |
| Padilla Jose Roberto | -- | -- | |
| Cooper Thomas E | $48,000 | -- | |
| Cooper Thomas E | -- | -- |
Source: Public Records
Mortgage History
| Date | Status | Borrower | Loan Amount |
|---|---|---|---|
| Previous Owner | Padilla Jose Roberto | $41,000 |
Source: Public Records
Tax History
| Year | Tax Paid | Tax Assessment Tax Assessment Total Assessment is a certain percentage of the fair market value that is determined by local assessors to be the total taxable value of land and additions on the property. | Land | Improvement |
|---|---|---|---|---|
| 2025 | $3,974 | $321,000 | $126,920 | $194,080 |
| 2024 | $3,974 | $293,221 | $116,483 | $176,738 |
| 2023 | $3,974 | $352,417 | $70,975 | $281,442 |
| 2022 | $5,255 | $294,455 | $70,975 | $223,480 |
| 2021 | $5,057 | $222,000 | $70,975 | $151,025 |
| 2020 | $4,777 | $197,250 | $70,975 | $126,275 |
| 2019 | $4,991 | $197,250 | $58,450 | $138,800 |
| 2018 | $3,717 | $197,520 | $48,848 | $148,672 |
| 2017 | $4,994 | $197,520 | $48,848 | $148,672 |
| 2016 | $3,544 | $140,165 | $45,925 | $94,240 |
| 2015 | $1,383 | $53,800 | $33,400 | $20,400 |
| 2014 | $1,383 | $53,800 | $33,400 | $20,400 |
Source: Public Records
Map
Nearby Homes
- 741 Mcdaniel St
- 743 Apache St
- 726 Mcdaniel St
- 714 Apache St
- 1104 Charnwood St
- 720 Caperton St
- 8109 W Hardy Rd
- 7714 Helmers St
- 916 Berry Rd
- 909 Yorkshire St Unit 8
- 822 Berry Sage Ln
- 802 Berry Sage Ln
- 8440 Berry Brush Ln
- 525 Eubanks St
- 1115 Post St
- 0 Appleton St
- 604 Yorkshire St
- 1815 Eubanks St
- 1009 Wainwright St
- 8205 Appleton St
- 913 Eubanks St
- 825 Eubanks St
- 823 Eubanks St
- 915 Eubanks St
- 915 Eubanks St
- 915 Eubanks St Unit A
- 821 Eubanks St
- 914 Apache St
- 912 Apache St
- 1002 Apache St
- 1006 Apache St
- 910 Apache St
- 1001 Eubanks St
- 819 Eubanks St
- 914 Eubanks St
- 902 Eubanks St
- 912 Eubanks St
- 824 Eubanks St
- 1008 Apache St
- 820 Apache St
Your Personal Tour Guide
Ask me questions while you tour the home.