Estimated Value: $421,775 - $459,000
3
Beds
3
Baths
2,391
Sq Ft
$183/Sq Ft
Est. Value
About This Home
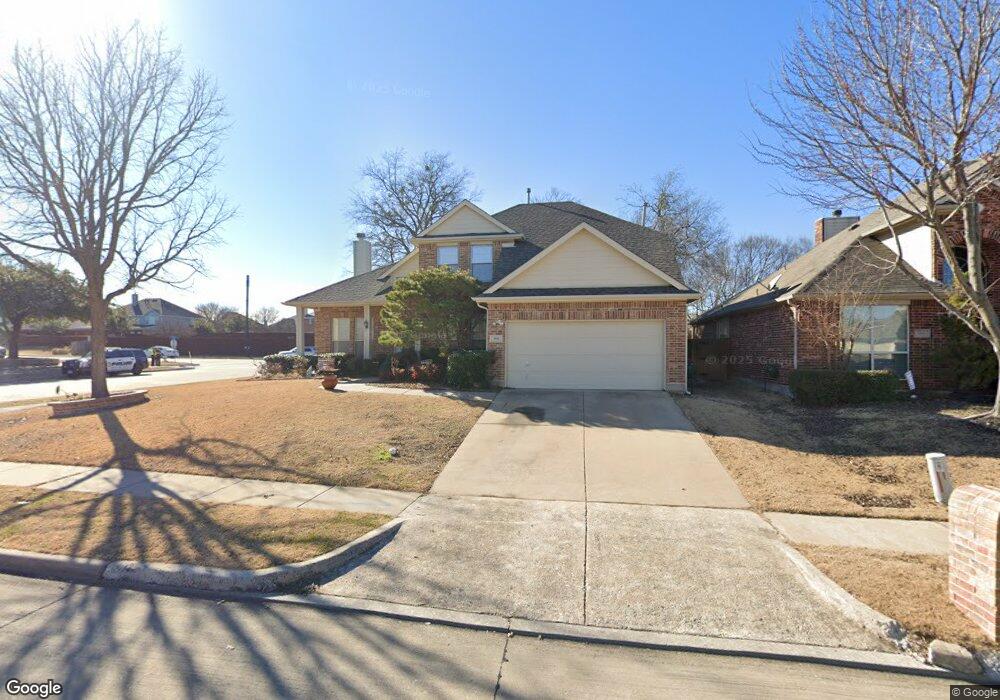
This home is located at 901 Fountain Dr, Wylie, TX 75098 and is currently estimated at $438,444, approximately $183 per square foot. 901 Fountain Dr is a home located in Collin County with nearby schools including R V Groves Elementary School, Dr. Al Draper Intermediate Middle School, and Raymond B Cooper J High School.
Ownership History
Date
Name
Owned For
Owner Type
Purchase Details
Closed on
May 14, 2008
Sold by
Copling Steven L and Copling Sonora N
Bought by
Hale Gregory A
Current Estimated Value
Home Financials for this Owner
Home Financials are based on the most recent Mortgage that was taken out on this home.
Original Mortgage
$197,660
Outstanding Balance
$125,243
Interest Rate
5.89%
Mortgage Type
VA
Estimated Equity
$313,201
Purchase Details
Closed on
Mar 25, 2002
Sold by
Ashton Dallas Residential Llc
Bought by
Copling Steven L and Copling Sonora M
Home Financials for this Owner
Home Financials are based on the most recent Mortgage that was taken out on this home.
Original Mortgage
$164,000
Interest Rate
6.78%
Purchase Details
Closed on
Oct 4, 2001
Sold by
Ashton Custer Llc
Bought by
Ashton Dallas Residential Llc
Create a Home Valuation Report for This Property
The Home Valuation Report is an in-depth analysis detailing your home's value as well as a comparison with similar homes in the area
Home Values in the Area
Average Home Value in this Area
Purchase History
| Date | Buyer | Sale Price | Title Company |
|---|---|---|---|
| Hale Gregory A | -- | Capital Title | |
| Copling Steven L | -- | -- | |
| Ashton Dallas Residential Llc | -- | Stewart Title North Texas In |
Source: Public Records
Mortgage History
| Date | Status | Borrower | Loan Amount |
|---|---|---|---|
| Open | Hale Gregory A | $197,660 | |
| Previous Owner | Copling Steven L | $164,000 | |
| Closed | Copling Steven L | $30,750 |
Source: Public Records
Tax History Compared to Growth
Tax History
| Year | Tax Paid | Tax Assessment Tax Assessment Total Assessment is a certain percentage of the fair market value that is determined by local assessors to be the total taxable value of land and additions on the property. | Land | Improvement |
|---|---|---|---|---|
| 2025 | $6,497 | $427,960 | $131,250 | $296,710 |
| 2024 | $6,497 | $395,200 | $131,250 | $284,538 |
| 2023 | $6,497 | $359,273 | $115,500 | $312,249 |
| 2022 | $7,166 | $326,612 | $94,500 | $270,695 |
| 2021 | $6,986 | $297,569 | $73,500 | $224,069 |
| 2020 | $6,702 | $269,927 | $68,250 | $201,677 |
| 2019 | $7,117 | $270,816 | $68,250 | $202,566 |
| 2018 | $7,071 | $262,577 | $68,250 | $194,327 |
| 2017 | $6,618 | $256,712 | $63,000 | $193,712 |
| 2016 | $6,207 | $230,544 | $52,500 | $178,044 |
| 2015 | $5,054 | $203,093 | $42,000 | $161,093 |
Source: Public Records
Map
Nearby Homes
- 3119 Connor Ln
- 802 Appalachian Dr
- 3014 Eastwood Dr
- 517 Royal Oak Dr
- 563 John Ross Rd
- 3105 Admiral Dr
- 2912 Katie Cir
- 310 Admiral Dr
- 1205 Periwinkle Dr
- 307 Wooded Creek Ave
- 413 Royal Oak Dr
- 2907 Abby Ln
- 620 Fall Wheat Dr
- 801 Hunters Glen
- 3111 Candlebrook Dr
- 728 Morningside Trail
- 3003 Candlebrook Dr
- 3017 Eagle Mountain Dr
- 3103 Creekwood Dr
- 3600 Nandina Dr
- 903 Fountain Dr
- 905 Fountain Dr
- 3400 Cascade Ct
- 3402 Cascade Ct
- 900 Fountain Dr
- 907 Fountain Dr
- 902 Fountain Dr
- 904 Fountain Dr
- 3400 Brookside Dr
- 3405 Cascade Ct
- 909 Fountain Dr
- 906 Fountain Dr
- 3402 Brookside Dr
- 3204 Waterpark Dr
- 3403 Cascade Ct
- 3400 Meandering Dr
- 608 Althea Dr
- 3118 Claybrook Dr
- 3116 Claybrook Dr
- 3401 Cascade Ct