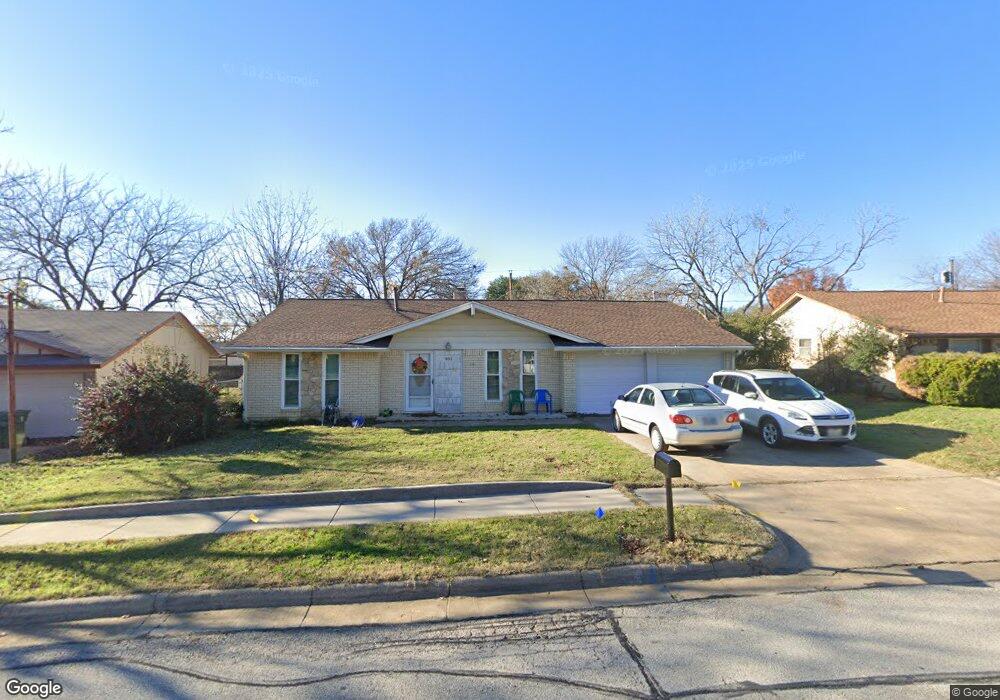
901 Gettysburg Place Bedford, TX 76022
Estimated Value: $302,329 - $336,000
3
Beds
2
Baths
1,448
Sq Ft
$221/Sq Ft
Est. Value
About This Home
This home is located at 901 Gettysburg Place, Bedford, TX 76022 and is currently estimated at $319,332, approximately $220 per square foot. 901 Gettysburg Place is a home located in Tarrant County with nearby schools including Bell Manor Elementary School, Central J High School, and Trinity High School.
Ownership History
Date
Name
Owned For
Owner Type
Purchase Details
Closed on
Jan 17, 2020
Sold by
Odom Thomas D and Odom Sue Anne
Bought by
Platt Jerald and Crockett Natalie
Current Estimated Value
Home Financials for this Owner
Home Financials are based on the most recent Mortgage that was taken out on this home.
Original Mortgage
$150,400
Outstanding Balance
$132,884
Interest Rate
3.6%
Mortgage Type
New Conventional
Estimated Equity
$186,448
Purchase Details
Closed on
Jan 7, 2010
Sold by
Paris C Martin
Bought by
Odom Thomas D and Odom Sue Anne
Home Financials for this Owner
Home Financials are based on the most recent Mortgage that was taken out on this home.
Original Mortgage
$96,000
Interest Rate
4.8%
Mortgage Type
New Conventional
Create a Home Valuation Report for This Property
The Home Valuation Report is an in-depth analysis detailing your home's value as well as a comparison with similar homes in the area
Home Values in the Area
Average Home Value in this Area
Purchase History
| Date | Buyer | Sale Price | Title Company |
|---|---|---|---|
| Platt Jerald | -- | Providence Title Company | |
| Odom Thomas D | -- | Stnt |
Source: Public Records
Mortgage History
| Date | Status | Borrower | Loan Amount |
|---|---|---|---|
| Open | Platt Jerald | $150,400 | |
| Previous Owner | Odom Thomas D | $96,000 |
Source: Public Records
Tax History Compared to Growth
Tax History
| Year | Tax Paid | Tax Assessment Tax Assessment Total Assessment is a certain percentage of the fair market value that is determined by local assessors to be the total taxable value of land and additions on the property. | Land | Improvement |
|---|---|---|---|---|
| 2025 | $2,403 | $250,000 | $65,000 | $185,000 |
| 2024 | $2,403 | $250,000 | $65,000 | $185,000 |
| 2023 | $4,851 | $258,223 | $45,000 | $213,223 |
| 2022 | $5,022 | $245,017 | $45,000 | $200,017 |
| 2021 | $4,924 | $209,014 | $45,000 | $164,014 |
| 2020 | $5,025 | $211,356 | $45,000 | $166,356 |
| 2019 | $5,167 | $212,676 | $45,000 | $167,676 |
| 2018 | $4,240 | $174,526 | $23,000 | $151,526 |
| 2017 | $3,827 | $158,191 | $23,000 | $135,191 |
| 2016 | $3,428 | $141,698 | $23,000 | $118,698 |
| 2015 | $3,197 | $127,300 | $18,000 | $109,300 |
| 2014 | $3,197 | $127,300 | $18,000 | $109,300 |
Source: Public Records
Map
Nearby Homes
- 952 Charleston Dr
- 804 Natchez Ave
- 933 Charleston Ct
- 1613 Trinity Ct
- 1604 Richmond Dr
- 2024 Charleston Dr
- 2101 Gettysburg Place
- 828 Gregory Ave
- 808 Gregory Ave
- 1701 Winchester Way
- 800 Prestwick St
- 904 Nelson Terrace
- 2201 Greendale Ct
- 1216 Princeton Place
- 2025 Schumac Ln
- 1049 Stableway Ln
- 1031 Boston Blvd
- 1213 Greendale Dr
- 1116 Highpoint Rd
- 2420 Dalewood Ln
- 905 Gettysburg Place
- 825 Gettysburg Place
- 904 Charleston Dr
- 908 Charleston Dr
- 821 Gettysburg Place
- 900 Charleston Dr
- 909 Gettysburg Place
- 912 Charleston Dr
- 900 Gettysburg Place
- 820 Gettysburg Place
- 908 Gettysburg Place
- 820 Charleston Dr
- 916 Charleston Dr
- 817 Gettysburg Place
- 816 Gettysburg Place
- 913 Gettysburg Place
- 912 Gettysburg Place
- 816 Charleston Dr
- 920 Charleston Dr
- 905 Charleston Dr