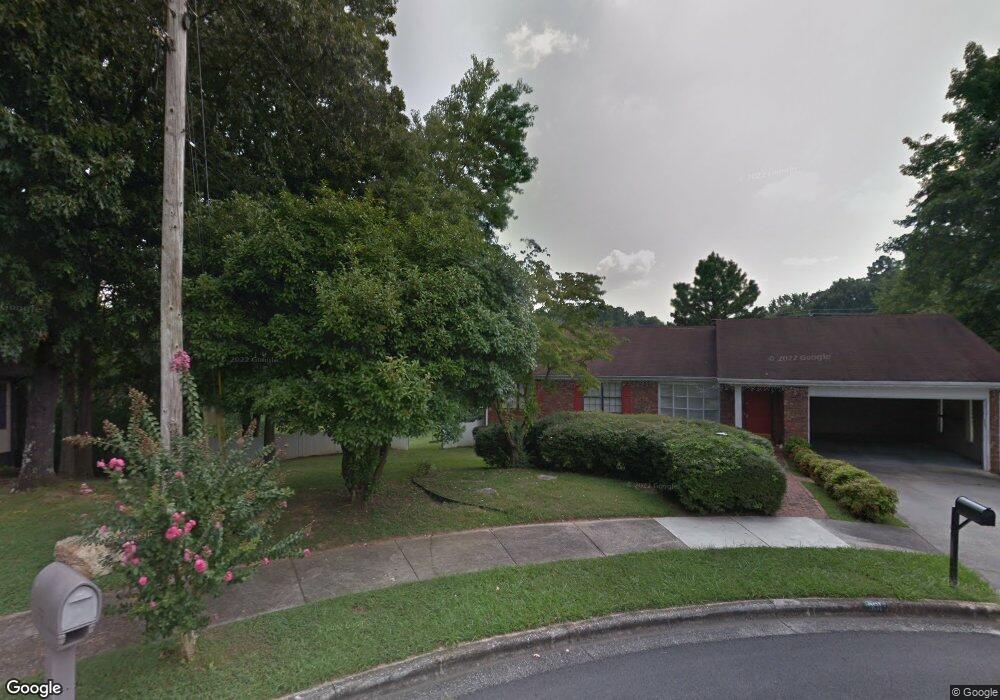
901 Johnson Ct Dalton, GA 30720
Estimated Value: $254,007 - $281,000
3
Beds
2
Baths
1,520
Sq Ft
$177/Sq Ft
Est. Value
About This Home
This home is located at 901 Johnson Ct, Dalton, GA 30720 and is currently estimated at $269,252, approximately $177 per square foot. 901 Johnson Ct is a home located in Whitfield County with nearby schools including Westwood Elementary School, Dalton High School, and Rock Hill School.
Ownership History
Date
Name
Owned For
Owner Type
Purchase Details
Closed on
Jun 30, 2010
Sold by
Federal Home Loan Mortgage Corporation
Bought by
Martinez Miguel
Current Estimated Value
Home Financials for this Owner
Home Financials are based on the most recent Mortgage that was taken out on this home.
Original Mortgage
$100,152
Outstanding Balance
$65,751
Interest Rate
4.87%
Mortgage Type
FHA
Estimated Equity
$203,501
Purchase Details
Closed on
Apr 24, 2006
Sold by
Cook Frances L
Bought by
Jovel Jose A
Home Financials for this Owner
Home Financials are based on the most recent Mortgage that was taken out on this home.
Original Mortgage
$138,320
Interest Rate
6.5%
Mortgage Type
New Conventional
Purchase Details
Closed on
Aug 14, 2000
Sold by
Oric Vickie U
Bought by
Cook Frances L
Purchase Details
Closed on
Sep 1, 1998
Bought by
Oric Vickie U
Create a Home Valuation Report for This Property
The Home Valuation Report is an in-depth analysis detailing your home's value as well as a comparison with similar homes in the area
Purchase History
| Date | Buyer | Sale Price | Title Company |
|---|---|---|---|
| Martinez Miguel | $102,000 | -- | |
| Jovel Jose A | $172,900 | -- | |
| Cook Frances L | $129,900 | -- | |
| Oric Vickie U | -- | -- |
Source: Public Records
Mortgage History
| Date | Status | Borrower | Loan Amount |
|---|---|---|---|
| Open | Martinez Miguel | $100,152 | |
| Previous Owner | Jovel Jose A | $138,320 | |
| Previous Owner | Jovel Jose A | $34,580 |
Source: Public Records
Tax History
| Year | Tax Paid | Tax Assessment Tax Assessment Total Assessment is a certain percentage of the fair market value that is determined by local assessors to be the total taxable value of land and additions on the property. | Land | Improvement |
|---|---|---|---|---|
| 2025 | $2,840 | $94,473 | $8,000 | $86,473 |
| 2024 | $2,840 | $94,473 | $8,000 | $86,473 |
| 2023 | $2,476 | $66,912 | $8,100 | $58,812 |
| 2022 | $1,872 | $54,341 | $5,670 | $48,671 |
| 2021 | $1,874 | $54,341 | $5,670 | $48,671 |
| 2020 | $1,947 | $54,341 | $5,670 | $48,671 |
| 2019 | $1,955 | $52,914 | $5,670 | $47,244 |
| 2018 | $1,909 | $50,916 | $5,670 | $45,246 |
| 2017 | $1,838 | $50,916 | $5,670 | $45,246 |
| 2016 | $1,746 | $48,063 | $6,615 | $41,448 |
| 2014 | $1,516 | $45,931 | $6,300 | $39,631 |
| 2013 | -- | $45,930 | $6,300 | $39,630 |
Source: Public Records
Map
Nearby Homes
- 902 W Tyler St
- 900 Johnson Ct
- 705 W Boundary St
- 703 W Boundary St
- 903 Johnson Ct
- 701 W Boundary St
- 906 W Tyler St
- 902 Johnson Ct
- 709 W Boundary St
- 900 W Tyler St
- 900 W Tyler St
- 904 Johnson Ct
- 1002 Clark St
- 908 W Tyler St
- 905 Johnson Ct
- 905 W Tyler St
- 903 W Tyler St
- 905 Johnson Ct
- 903 Cascade Dr
- 613 W Boundary St
Your Personal Tour Guide
Ask me questions while you tour the home.