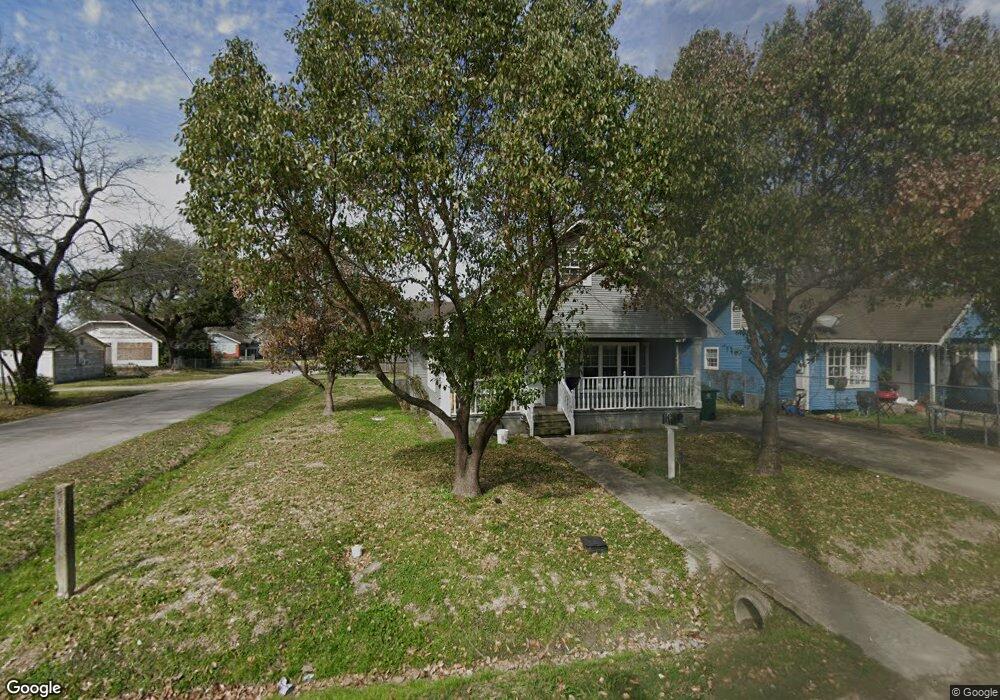
901 King St Houston, TX 77022
Northside-Northline NeighborhoodEstimated Value: $203,738 - $308,000
3
Beds
1
Bath
1,181
Sq Ft
$232/Sq Ft
Est. Value
About This Home
This home is located at 901 King St, Houston, TX 77022 and is currently estimated at $274,435, approximately $232 per square foot. 901 King St is a home located in Harris County with nearby schools including Roosevelt Elementary School, Burbank Middle School, and Northside High School.
Ownership History
Date
Name
Owned For
Owner Type
Purchase Details
Closed on
Aug 22, 2008
Sold by
Montemayor Juvental and Montemayor Maria J
Bought by
Reyes Ruben and Reyes Rafael
Current Estimated Value
Home Financials for this Owner
Home Financials are based on the most recent Mortgage that was taken out on this home.
Original Mortgage
$94,351
Outstanding Balance
$62,740
Interest Rate
6.6%
Mortgage Type
FHA
Estimated Equity
$211,695
Purchase Details
Closed on
May 4, 1991
Sold by
Rodriguez Sofia
Bought by
Montemayor Juvental and Montemayor Maria J
Create a Home Valuation Report for This Property
The Home Valuation Report is an in-depth analysis detailing your home's value as well as a comparison with similar homes in the area
Home Values in the Area
Average Home Value in this Area
Purchase History
| Date | Buyer | Sale Price | Title Company |
|---|---|---|---|
| Reyes Ruben | -- | Etc | |
| Montemayor Juvental | -- | None Available |
Source: Public Records
Mortgage History
| Date | Status | Borrower | Loan Amount |
|---|---|---|---|
| Open | Reyes Ruben | $94,351 |
Source: Public Records
Tax History Compared to Growth
Tax History
| Year | Tax Paid | Tax Assessment Tax Assessment Total Assessment is a certain percentage of the fair market value that is determined by local assessors to be the total taxable value of land and additions on the property. | Land | Improvement |
|---|---|---|---|---|
| 2025 | $2,726 | $201,850 | $108,000 | $93,850 |
| 2024 | $2,726 | $188,825 | $54,000 | $134,825 |
| 2023 | $2,726 | $188,825 | $54,000 | $134,825 |
| 2022 | $3,051 | $153,229 | $54,000 | $99,229 |
| 2021 | $2,936 | $125,983 | $54,000 | $71,983 |
| 2020 | $3,051 | $125,983 | $54,000 | $71,983 |
| 2019 | $2,909 | $125,983 | $54,000 | $71,983 |
| 2018 | $2,234 | $104,498 | $54,000 | $50,498 |
| 2017 | $2,469 | $104,498 | $54,000 | $50,498 |
| 2016 | $2,244 | $104,498 | $54,000 | $50,498 |
| 2015 | $1,642 | $80,692 | $28,350 | $52,342 |
| 2014 | $1,642 | $63,889 | $28,350 | $35,539 |
Source: Public Records
Map
Nearby Homes