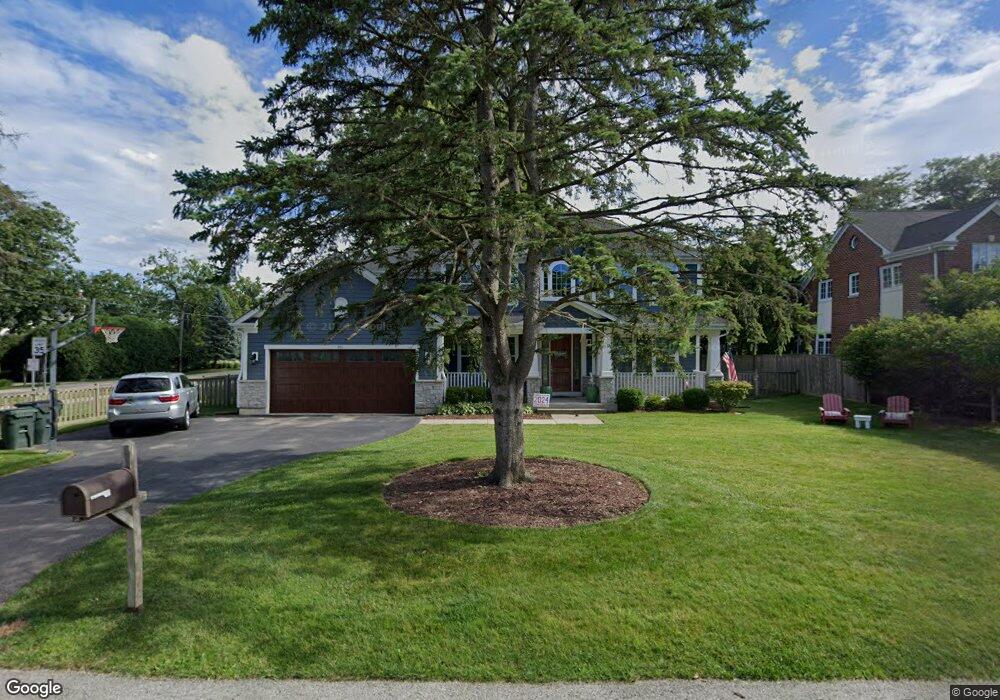
901 Kings Ln Glenview, IL 60025
Estimated Value: $557,000 - $1,417,000
3
Beds
2
Baths
1,188
Sq Ft
$745/Sq Ft
Est. Value
About This Home
This home is located at 901 Kings Ln, Glenview, IL 60025 and is currently estimated at $884,608, approximately $744 per square foot. 901 Kings Ln is a home located in Cook County with nearby schools including Lyon Elementary School, Pleasant Ridge Elementary School, and Attea Middle School.
Ownership History
Date
Name
Owned For
Owner Type
Purchase Details
Closed on
Nov 3, 2025
Sold by
Barron Daniel G and Barron Sara K
Bought by
Jones Edward and Jones Shanna
Current Estimated Value
Home Financials for this Owner
Home Financials are based on the most recent Mortgage that was taken out on this home.
Original Mortgage
$1,100,000
Outstanding Balance
$1,100,000
Interest Rate
5.75%
Mortgage Type
New Conventional
Estimated Equity
-$215,392
Purchase Details
Closed on
Jul 16, 2012
Sold by
American Bank And Trust
Bought by
Barron Daniel G and Barron Sara K
Home Financials for this Owner
Home Financials are based on the most recent Mortgage that was taken out on this home.
Original Mortgage
$165,750
Interest Rate
6%
Mortgage Type
New Conventional
Purchase Details
Closed on
Jun 16, 2000
Sold by
Ellew George and Ellew Anne
Bought by
Ellew George and Ellew Anne
Create a Home Valuation Report for This Property
The Home Valuation Report is an in-depth analysis detailing your home's value as well as a comparison with similar homes in the area
Home Values in the Area
Average Home Value in this Area
Purchase History
| Date | Buyer | Sale Price | Title Company |
|---|---|---|---|
| Jones Edward | $1,375,000 | Chicago Title | |
| Barron Daniel G | $220,000 | None Available | |
| Ellew George | -- | -- |
Source: Public Records
Mortgage History
| Date | Status | Borrower | Loan Amount |
|---|---|---|---|
| Open | Jones Edward | $1,100,000 | |
| Previous Owner | Barron Daniel G | $165,750 |
Source: Public Records
Tax History Compared to Growth
Tax History
| Year | Tax Paid | Tax Assessment Tax Assessment Total Assessment is a certain percentage of the fair market value that is determined by local assessors to be the total taxable value of land and additions on the property. | Land | Improvement |
|---|---|---|---|---|
| 2024 | $9,890 | $48,000 | $11,880 | $36,120 |
| 2023 | $9,589 | $48,000 | $11,880 | $36,120 |
| 2022 | $9,589 | $48,000 | $11,880 | $36,120 |
| 2021 | $8,539 | $37,640 | $7,590 | $30,050 |
| 2020 | $8,588 | $37,640 | $7,590 | $30,050 |
| 2019 | $8,009 | $41,363 | $7,590 | $33,773 |
| 2018 | $6,893 | $33,018 | $6,600 | $26,418 |
| 2017 | $6,726 | $33,018 | $6,600 | $26,418 |
| 2016 | $6,553 | $33,018 | $6,600 | $26,418 |
| 2015 | $7,578 | $33,953 | $5,280 | $28,673 |
| 2014 | $8,065 | $33,953 | $5,280 | $28,673 |
| 2013 | $7,820 | $33,953 | $5,280 | $28,673 |
Source: Public Records
Map
Nearby Homes
- 118 Dickens Rd
- 711 Becker Rd
- 2033 Winnetka Rd
- 236 Bristol St
- 1050 Burton Terrace
- 1410 Tuscany Ct
- 4072 Bunker Ln
- 5020 Arbor Ln Unit 203
- 1553 Hawthorne Ln
- 19 Landmark
- 1721 Northfield Square Unit C
- 1701 Northfield Square Unit E
- 387 Bristol St
- 185 Happ Rd
- 1656 Harding Rd
- 1857 Willowview Terrace Unit 1857
- 2185 New Willow Rd
- 2101 Valley lo Ln
- 1740 Melise Dr
- 1635 Elder Ln