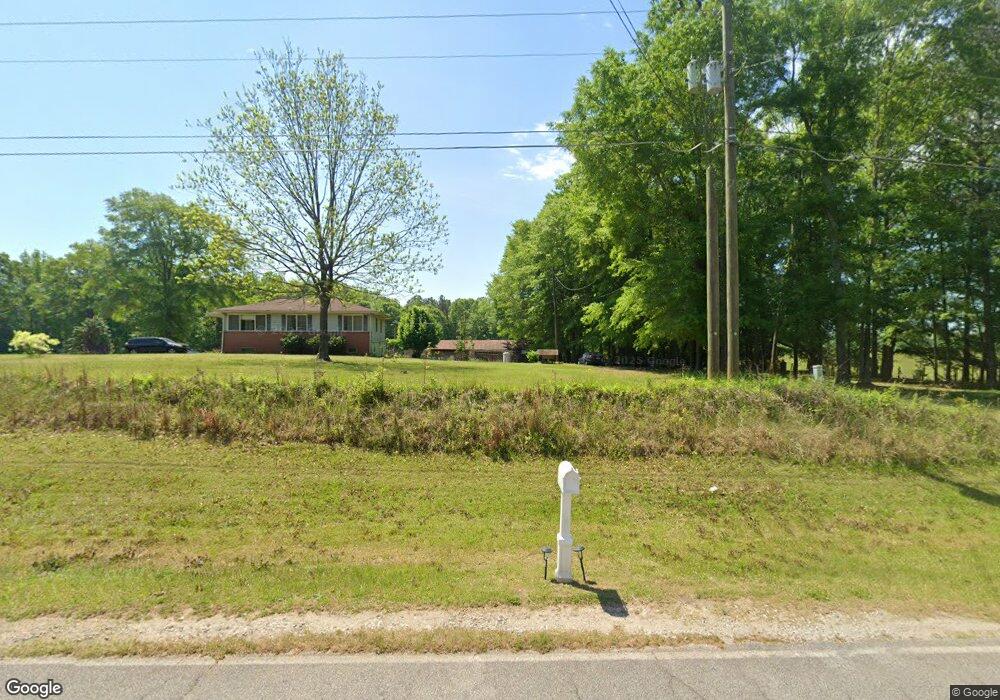
901 Manley Rd Griffin, GA 30223
Spalding County NeighborhoodEstimated Value: $251,000 - $368,000
3
Beds
1
Bath
1,174
Sq Ft
$245/Sq Ft
Est. Value
About This Home
This home is located at 901 Manley Rd, Griffin, GA 30223 and is currently estimated at $287,537, approximately $244 per square foot. 901 Manley Rd is a home located in Spalding County with nearby schools including Beaverbrook Elementary School, Cowan Road Middle School, and Griffin High School.
Ownership History
Date
Name
Owned For
Owner Type
Purchase Details
Closed on
Mar 3, 2015
Sold by
Thiphasone Thongsouk
Bought by
Phosai Phaiwan
Current Estimated Value
Home Financials for this Owner
Home Financials are based on the most recent Mortgage that was taken out on this home.
Original Mortgage
$63,113
Outstanding Balance
$48,356
Interest Rate
3.69%
Mortgage Type
New Conventional
Estimated Equity
$239,181
Purchase Details
Closed on
May 1, 2009
Sold by
Stewart Janice H
Bought by
Phosai Phaiwan and Thiphasone Thongsouk
Home Financials for this Owner
Home Financials are based on the most recent Mortgage that was taken out on this home.
Original Mortgage
$138,000
Interest Rate
4.86%
Mortgage Type
Trade
Purchase Details
Closed on
Sep 14, 2004
Sold by
Wood Arymond L
Bought by
Stewart Janice H
Purchase Details
Closed on
May 6, 1983
Sold by
Wood John R and Wood Lavonia I
Bought by
Wood John R
Purchase Details
Closed on
Aug 18, 1976
Sold by
Dortch Roy M
Bought by
Wood John R and Wood Lavona I
Purchase Details
Closed on
Aug 2, 1973
Sold by
Peacock Peacock H and Peacock Helen W
Bought by
Dortch Roy M
Purchase Details
Closed on
Mar 27, 1959
Bought by
Peacock Peacock H and Peacock Helen W
Create a Home Valuation Report for This Property
The Home Valuation Report is an in-depth analysis detailing your home's value as well as a comparison with similar homes in the area
Home Values in the Area
Average Home Value in this Area
Purchase History
| Date | Buyer | Sale Price | Title Company |
|---|---|---|---|
| Phosai Phaiwan | -- | -- | |
| Phosai Phaiwan | $153,000 | -- | |
| Stewart Janice H | $130,000 | -- | |
| Wood John R | -- | -- | |
| Wood John R | $3,700 | -- | |
| Dortch Roy M | $75,000 | -- | |
| Peacock Peacock H | -- | -- |
Source: Public Records
Mortgage History
| Date | Status | Borrower | Loan Amount |
|---|---|---|---|
| Open | Phosai Phaiwan | $63,113 | |
| Previous Owner | Phosai Phaiwan | $138,000 |
Source: Public Records
Tax History Compared to Growth
Tax History
| Year | Tax Paid | Tax Assessment Tax Assessment Total Assessment is a certain percentage of the fair market value that is determined by local assessors to be the total taxable value of land and additions on the property. | Land | Improvement |
|---|---|---|---|---|
| 2024 | $2,426 | $67,739 | $44,480 | $23,259 |
| 2023 | $2,463 | $67,739 | $44,480 | $23,259 |
| 2022 | $2,059 | $56,620 | $36,140 | $20,480 |
| 2021 | $2,001 | $55,033 | $36,140 | $18,893 |
| 2020 | $2,008 | $55,033 | $36,140 | $18,893 |
| 2019 | $1,712 | $55,033 | $36,140 | $18,893 |
| 2018 | $1,689 | $53,270 | $36,140 | $17,130 |
| 2017 | $1,645 | $53,270 | $36,140 | $17,130 |
| 2016 | $1,673 | $53,270 | $36,140 | $17,130 |
| 2015 | $1,726 | $53,270 | $36,140 | $17,130 |
| 2014 | $1,758 | $53,270 | $36,140 | $17,130 |
Source: Public Records
Map
Nearby Homes
- 78 Helen Dr
- 0 Elder Rd Unit 25075151
- 0 Elder Rd Unit 10619475
- 813 Vineyard Rd
- 1060 Patterson Rd
- 1100 Patterson Rd
- 1120 Patterson Rd
- 111 Patterson Rd
- 1022 Serene Lake Dr
- 114 Woodcrest Dr
- 204 Vineyard Ridge Dr
- 697 Steele Rd
- 230 Manley Rd
- 130 N Morgan Dr
- 110 Janie Ln
- 1156 Burgundy Dr
- 265 Steele Rd
- 313 Sammy Cir
- 1115 Burgundy Dr
- 1100 Stiles Crossing