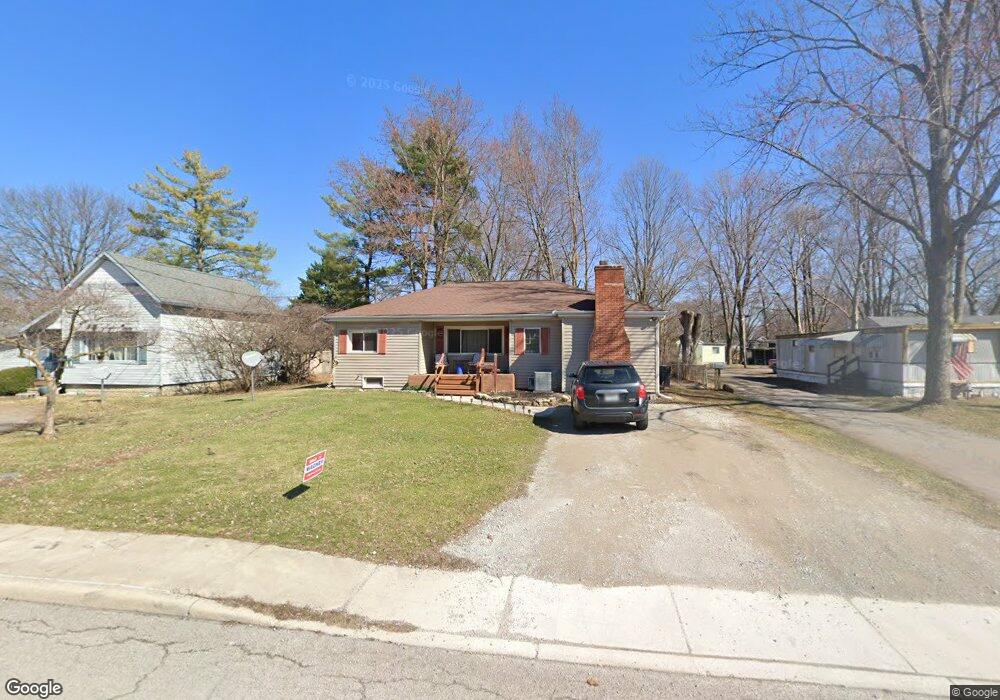
901 Morse St Findlay, OH 45840
Estimated Value: $151,718 - $185,000
3
Beds
1
Bath
1,256
Sq Ft
$128/Sq Ft
Est. Value
About This Home
This home is located at 901 Morse St, Findlay, OH 45840 and is currently estimated at $160,680, approximately $127 per square foot. 901 Morse St is a home located in Hancock County with nearby schools including Whittier Elementary School, Wilson Vance Elementary School, and Donnell Middle School.
Ownership History
Date
Name
Owned For
Owner Type
Purchase Details
Closed on
May 11, 1989
Bought by
Nelson Billy R and Nelson Linda
Current Estimated Value
Purchase Details
Closed on
Dec 19, 1988
Bought by
Adm Veterans Affairs
Create a Home Valuation Report for This Property
The Home Valuation Report is an in-depth analysis detailing your home's value as well as a comparison with similar homes in the area
Home Values in the Area
Average Home Value in this Area
Purchase History
| Date | Buyer | Sale Price | Title Company |
|---|---|---|---|
| Nelson Billy R | -- | -- | |
| Adm Veterans Affairs | -- | -- |
Source: Public Records
Tax History
| Year | Tax Paid | Tax Assessment Tax Assessment Total Assessment is a certain percentage of the fair market value that is determined by local assessors to be the total taxable value of land and additions on the property. | Land | Improvement |
|---|---|---|---|---|
| 2024 | $1,395 | $38,260 | $6,240 | $32,020 |
| 2023 | $1,397 | $38,260 | $6,240 | $32,020 |
| 2022 | $1,392 | $38,260 | $6,240 | $32,020 |
| 2021 | $1,224 | $29,300 | $6,230 | $23,070 |
| 2020 | $1,224 | $29,300 | $6,230 | $23,070 |
| 2019 | $1,200 | $29,300 | $6,230 | $23,070 |
| 2018 | $1,047 | $23,420 | $5,670 | $17,750 |
| 2017 | $523 | $23,420 | $5,670 | $17,750 |
| 2016 | $1,041 | $23,420 | $5,670 | $17,750 |
| 2015 | $1,271 | $28,260 | $5,670 | $22,590 |
| 2014 | $1,271 | $28,260 | $5,670 | $22,590 |
| 2012 | $1,177 | $25,920 | $3,780 | $22,140 |
Source: Public Records
Map
Nearby Homes
- 15591 Canadian Way
- 15586 Canadian Way
- 15615 Canadian Way
- 1037 Fishlock Ave
- 829 Maple Ave
- 1100 Stall Dr
- 731 5th St
- 216 1st St
- 1200 1st St
- 1001 Decker Ave
- 865 S Main St
- 309 Huron Rd
- 206 Greenlawn Ave
- 0 Blanchard Ave
- 123 Glendale Ave
- 1421 E Sandusky St
- 1421 Autumn Dr
- 523 Center St
- 640 Center St
- 1726 Eastview Dr
Your Personal Tour Guide
Ask me questions while you tour the home.