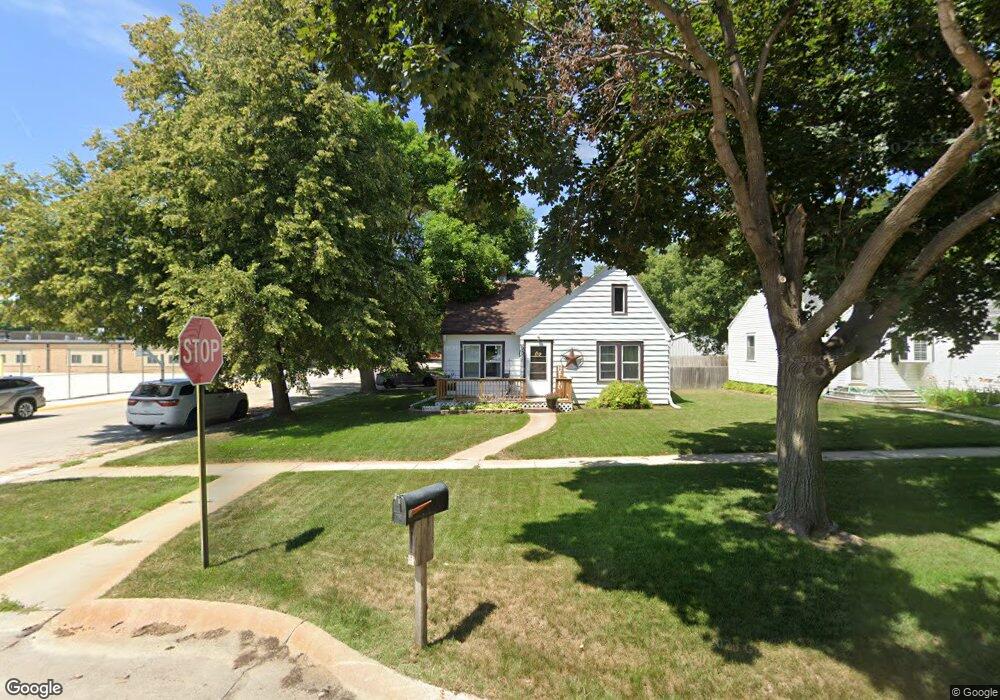
901 N 11th Ave Broken Bow, NE 68822
Estimated Value: $95,000 - $131,000
--
Bed
1
Bath
810
Sq Ft
$136/Sq Ft
Est. Value
About This Home
This home is located at 901 N 11th Ave, Broken Bow, NE 68822 and is currently estimated at $110,133, approximately $135 per square foot. 901 N 11th Ave is a home located in Custer County with nearby schools including North Park Elementary School, Broken Bow Junior High School, and Broken Bow High School.
Ownership History
Date
Name
Owned For
Owner Type
Purchase Details
Closed on
Jul 15, 2024
Sold by
Carrizales Barbara M
Bought by
Eichelberger Dustin
Current Estimated Value
Home Financials for this Owner
Home Financials are based on the most recent Mortgage that was taken out on this home.
Original Mortgage
$92,150
Outstanding Balance
$90,885
Interest Rate
6.99%
Mortgage Type
Construction
Estimated Equity
$19,248
Purchase Details
Closed on
Mar 2, 2010
Sold by
Penny Diane L
Bought by
Carrizales Barbara M
Create a Home Valuation Report for This Property
The Home Valuation Report is an in-depth analysis detailing your home's value as well as a comparison with similar homes in the area
Home Values in the Area
Average Home Value in this Area
Purchase History
| Date | Buyer | Sale Price | Title Company |
|---|---|---|---|
| Eichelberger Dustin | $95,000 | Central Nebraska Title & Escro | |
| Carrizales Barbara M | $58,000 | -- |
Source: Public Records
Mortgage History
| Date | Status | Borrower | Loan Amount |
|---|---|---|---|
| Open | Eichelberger Dustin | $92,150 |
Source: Public Records
Tax History Compared to Growth
Tax History
| Year | Tax Paid | Tax Assessment Tax Assessment Total Assessment is a certain percentage of the fair market value that is determined by local assessors to be the total taxable value of land and additions on the property. | Land | Improvement |
|---|---|---|---|---|
| 2025 | $1,002 | $103,447 | $8,960 | $94,487 |
| 2024 | $1,002 | $74,753 | $8,960 | $65,793 |
| 2023 | $173 | $77,297 | $8,960 | $68,337 |
| 2022 | $62 | $75,734 | $8,960 | $66,774 |
| 2021 | $62 | $75,174 | $8,400 | $66,774 |
| 2020 | $52 | $75,174 | $8,400 | $66,774 |
| 2019 | $52 | $61,746 | $4,200 | $57,546 |
| 2017 | $0 | $58,175 | $4,200 | $53,975 |
| 2016 | $1,133 | $56,719 | $2,744 | $53,975 |
| 2015 | $1,090 | $54,093 | $2,712 | $51,381 |
| 2014 | $1,090 | $49,175 | $2,465 | $46,710 |
Source: Public Records
Map
Nearby Homes