Estimated Value: $76,000 - $101,000
2
Beds
1
Bath
1,156
Sq Ft
$78/Sq Ft
Est. Value
About This Home
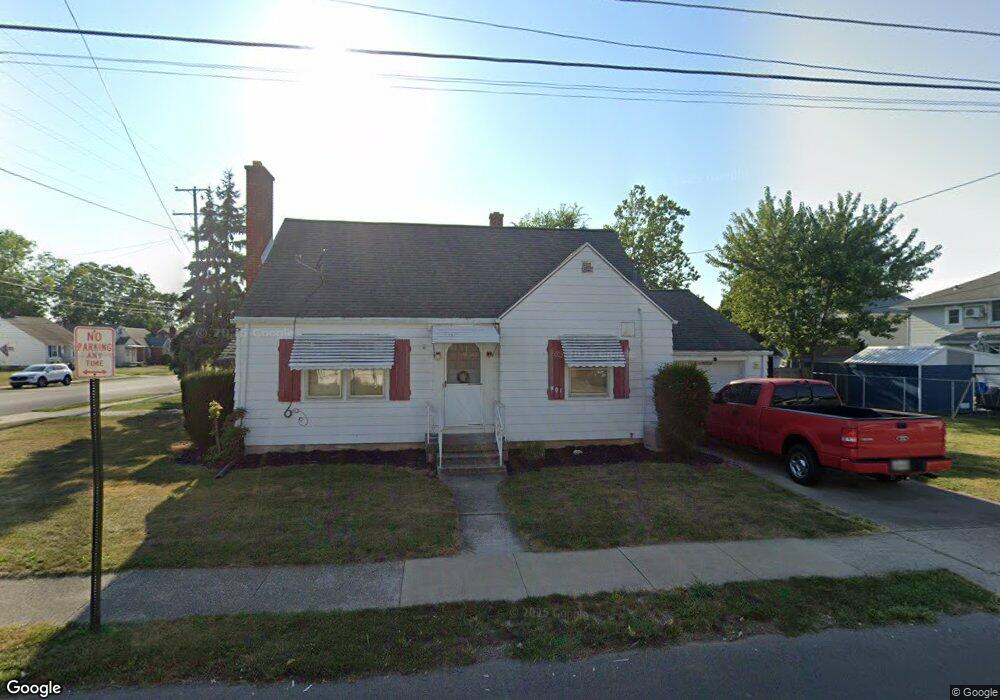
This home is located at 901 N Baxter St, Lima, OH 45801 and is currently estimated at $89,737, approximately $77 per square foot. 901 N Baxter St is a home located in Allen County with nearby schools including Independence Elementary School, Lima North Middle School, and Lima West Middle School.
Ownership History
Date
Name
Owned For
Owner Type
Purchase Details
Closed on
Dec 16, 2005
Sold by
Fisher Investment Property Inc and Fisher Todd L
Bought by
Bratton Steve
Current Estimated Value
Home Financials for this Owner
Home Financials are based on the most recent Mortgage that was taken out on this home.
Original Mortgage
$59,500
Outstanding Balance
$37,063
Interest Rate
8.27%
Mortgage Type
Adjustable Rate Mortgage/ARM
Estimated Equity
$52,674
Purchase Details
Closed on
Sep 9, 2005
Sold by
Shrider Anna Mae
Bought by
Fisher Investment Property Inc
Purchase Details
Closed on
Aug 23, 1989
Bought by
Shrider Anna Mae
Create a Home Valuation Report for This Property
The Home Valuation Report is an in-depth analysis detailing your home's value as well as a comparison with similar homes in the area
Purchase History
| Date | Buyer | Sale Price | Title Company |
|---|---|---|---|
| Bratton Steve | $59,500 | None Available | |
| Fisher Investment Property Inc | $42,000 | None Available | |
| Shrider Anna Mae | $35,000 | -- |
Source: Public Records
Mortgage History
| Date | Status | Borrower | Loan Amount |
|---|---|---|---|
| Open | Bratton Steve | $59,500 |
Source: Public Records
Tax History
| Year | Tax Paid | Tax Assessment Tax Assessment Total Assessment is a certain percentage of the fair market value that is determined by local assessors to be the total taxable value of land and additions on the property. | Land | Improvement |
|---|---|---|---|---|
| 2024 | $753 | $29,930 | $2,940 | $26,990 |
| 2023 | $855 | $20,240 | $2,000 | $18,240 |
| 2022 | $859 | $20,240 | $2,000 | $18,240 |
| 2021 | $910 | $20,240 | $2,000 | $18,240 |
| 2020 | $803 | $15,650 | $1,890 | $13,760 |
| 2019 | $803 | $15,650 | $1,890 | $13,760 |
| 2018 | $800 | $15,650 | $1,890 | $13,760 |
| 2017 | $805 | $15,650 | $1,890 | $13,760 |
| 2016 | $816 | $15,650 | $1,890 | $13,760 |
| 2015 | $861 | $15,650 | $1,890 | $13,760 |
| 2014 | $861 | $16,320 | $1,860 | $14,460 |
| 2013 | $838 | $16,320 | $1,860 | $14,460 |
Source: Public Records
Map
Nearby Homes
- 841 N Baxter St
- 816 N Baxter St
- 638 Hazel Ave
- 631 Hazel Ave
- 934 N Metcalf St
- 555 Haller St
- 703 N Collett St
- 435 Marian Ave
- 635 W Ashton Ave
- 615 N Collett St
- 416 Hazel Ave
- 406 Ewing Ave
- 618 Woodward Ave
- 949 Leland Ave
- 557 W Ashton Ave
- 745 Richie Ave
- 956 Rice Ave
- 576 W Ashton Ave
- 508 N Collett St
- 974 Richie Ave
Your Personal Tour Guide
Ask me questions while you tour the home.