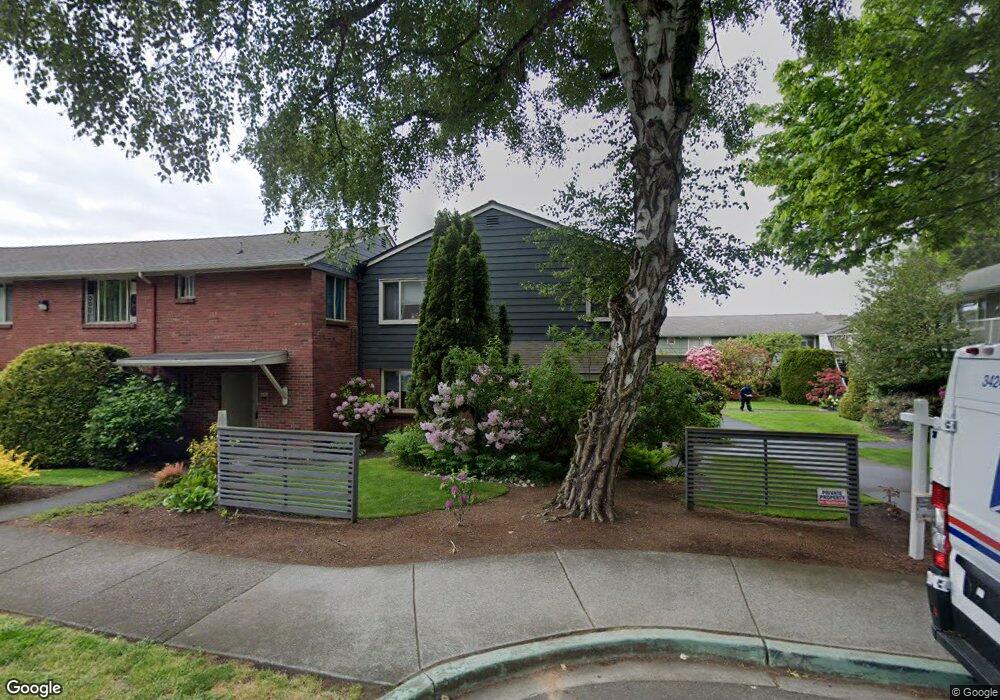
901 N Forest St Unit 136 Bellingham, WA 98225
Sehome NeighborhoodEstimated Value: $291,639 - $318,000
1
Bed
1
Bath
669
Sq Ft
$460/Sq Ft
Est. Value
About This Home
This home is located at 901 N Forest St Unit 136, Bellingham, WA 98225 and is currently estimated at $307,910, approximately $460 per square foot. 901 N Forest St Unit 136 is a home located in Whatcom County with nearby schools including Lowell Elementary School, Fairhaven Middle School, and Sehome High School.
Ownership History
Date
Name
Owned For
Owner Type
Purchase Details
Closed on
Mar 18, 2014
Sold by
Gallery Jillian M and Mosher Serksnys Jill
Bought by
Vitalich Andrea
Current Estimated Value
Home Financials for this Owner
Home Financials are based on the most recent Mortgage that was taken out on this home.
Original Mortgage
$126,350
Outstanding Balance
$95,440
Interest Rate
4.25%
Mortgage Type
New Conventional
Estimated Equity
$212,470
Purchase Details
Closed on
May 30, 2000
Sold by
Serksnys Stanley
Bought by
Mosher Serksnys Jill
Home Financials for this Owner
Home Financials are based on the most recent Mortgage that was taken out on this home.
Original Mortgage
$44,000
Interest Rate
8.18%
Create a Home Valuation Report for This Property
The Home Valuation Report is an in-depth analysis detailing your home's value as well as a comparison with similar homes in the area
Home Values in the Area
Average Home Value in this Area
Purchase History
| Date | Buyer | Sale Price | Title Company |
|---|---|---|---|
| Vitalich Andrea | $133,280 | Whatcom Land Title | |
| Mosher Serksnys Jill | -- | Island Title | |
| Mosher Serksnys Jill | $55,000 | Island Title |
Source: Public Records
Mortgage History
| Date | Status | Borrower | Loan Amount |
|---|---|---|---|
| Open | Vitalich Andrea | $126,350 | |
| Previous Owner | Mosher Serksnys Jill | $44,000 |
Source: Public Records
Tax History Compared to Growth
Tax History
| Year | Tax Paid | Tax Assessment Tax Assessment Total Assessment is a certain percentage of the fair market value that is determined by local assessors to be the total taxable value of land and additions on the property. | Land | Improvement |
|---|---|---|---|---|
| 2024 | $2,292 | $294,122 | $52,640 | $241,482 |
| 2023 | $2,292 | $294,122 | $52,640 | $241,482 |
| 2022 | $1,998 | $243,081 | $43,505 | $199,576 |
| 2021 | $1,925 | $215,116 | $38,500 | $176,616 |
| 2020 | $1,633 | $195,560 | $35,000 | $160,560 |
| 2019 | $1,347 | $160,402 | $52,445 | $107,957 |
| 2018 | $1,492 | $132,620 | $43,362 | $89,258 |
| 2017 | $1,236 | $125,626 | $41,064 | $84,562 |
| 2016 | $1,110 | $108,728 | $35,539 | $73,189 |
| 2015 | $1,122 | $101,703 | $33,264 | $68,439 |
| 2014 | -- | $99,400 | $32,500 | $66,900 |
| 2013 | -- | $97,138 | $30,450 | $66,688 |
Source: Public Records
Map
Nearby Homes
- 901 N Forest St Unit 107
- 901 N Forest St Unit 125
- 901 N Forest St Unit 109
- 310 E Ivy St
- 1001 N State St Unit 403
- 1031 N State St Unit 107
- 1031 N State St Unit 209
- 615 E Myrtle St
- 1015 Railroad Ave Unit 418
- 616 E Myrtle St
- 1126 N Forest St
- 0 Pine St Unit NWM2445229
- 414 Boulevard Unit 105
- 415 N State St
- 1309 Billy Frank Jr St
- 1025 Granary Ave Unit 503
- 1025 Granary Ave Unit 404
- 1025 Granary Ave Unit 306
- 1025 Granary Ave Unit 506
- 1025 Granary Ave Unit 501-A
- 901 N Forest St
- 901 N Forest St Unit 148
- 901 N Forest St Unit 147
- 901 N Forest St Unit 145
- 901 N Forest St Unit 144
- 901 N Forest St Unit 143
- 901 N Forest St Unit 142
- 901 N Forest St Unit 140
- 901 N Forest St Unit 139
- 901 N Forest St Unit 138
- 901 N Forest St Unit 137
- 901 N Forest St Unit 135
- 901 N Forest St Unit 134
- 901 N Forest St Unit 133
- 901 N Forest St Unit 132
- 901 N Forest St Unit 131
- 901 N Forest St Unit 129
- 901 N Forest St Unit 128
- 901 N Forest St Unit 127
- 901 N Forest St Unit 126