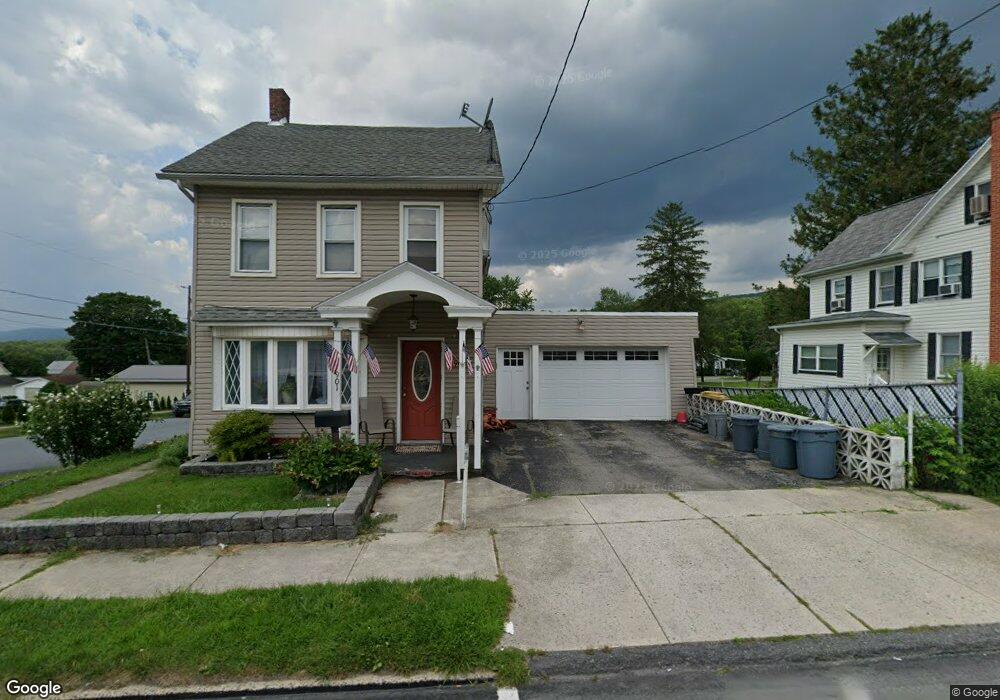
901 North St Jim Thorpe, PA 18229
Estimated Value: $221,470 - $270,000
4
Beds
2
Baths
2,174
Sq Ft
$116/Sq Ft
Est. Value
About This Home
This home is located at 901 North St, Jim Thorpe, PA 18229 and is currently estimated at $253,118, approximately $116 per square foot. 901 North St is a home located in Carbon County with nearby schools including Jim Thorpe Area High School and Sts. Peter & Paul School.
Ownership History
Date
Name
Owned For
Owner Type
Purchase Details
Closed on
Jul 2, 2012
Sold by
Remmel Lori and Miller Lori L
Bought by
Miller Lori L
Current Estimated Value
Home Financials for this Owner
Home Financials are based on the most recent Mortgage that was taken out on this home.
Original Mortgage
$140,880
Outstanding Balance
$94,805
Interest Rate
3.75%
Mortgage Type
FHA
Estimated Equity
$158,313
Purchase Details
Closed on
Feb 18, 2009
Sold by
Remmel Keith and Remmel Lori
Bought by
Remmel Lori and Rhode Lori L
Home Financials for this Owner
Home Financials are based on the most recent Mortgage that was taken out on this home.
Original Mortgage
$146,214
Interest Rate
5.14%
Mortgage Type
FHA
Purchase Details
Closed on
May 24, 2007
Sold by
Redline Irene
Bought by
Remmel Ii Keith and Remmel Lori
Home Financials for this Owner
Home Financials are based on the most recent Mortgage that was taken out on this home.
Original Mortgage
$112,000
Interest Rate
6.27%
Mortgage Type
New Conventional
Create a Home Valuation Report for This Property
The Home Valuation Report is an in-depth analysis detailing your home's value as well as a comparison with similar homes in the area
Home Values in the Area
Average Home Value in this Area
Purchase History
We collect this data history from publicly available records. To have your information removed, we recommend requesting removal directly through your county’s website.
| Date | Buyer | Sale Price | Title Company |
|---|---|---|---|
| Miller Lori L | -- | None Available | |
| Remmel Lori | -- | None Available | |
| Remmel Ii Keith | $140,000 | None Available |
Source: Public Records
Mortgage History
We collect this data history from publicly available records. To have your information removed, we recommend requesting removal directly through your county’s website.
| Date | Status | Borrower | Loan Amount |
|---|---|---|---|
| Open | Miller Lori L | $140,880 | |
| Closed | Remmel Lori | $146,214 | |
| Closed | Remmel Ii Keith | $112,000 |
Source: Public Records
Tax History
| Year | Tax Paid | Tax Assessment Tax Assessment Total Assessment is a certain percentage of the fair market value that is determined by local assessors to be the total taxable value of land and additions on the property. | Land | Improvement |
|---|---|---|---|---|
| 2026 | $3,262 | $41,100 | $12,850 | $28,250 |
| 2025 | $3,262 | $41,100 | $12,850 | $28,250 |
| 2024 | $3,139 | $41,100 | $12,850 | $28,250 |
| 2023 | $3,082 | $41,100 | $12,850 | $28,250 |
| 2022 | $3,032 | $41,100 | $12,850 | $28,250 |
| 2021 | $3,032 | $41,100 | $12,850 | $28,250 |
| 2020 | $2,927 | $41,100 | $12,850 | $28,250 |
| 2019 | $2,845 | $41,100 | $12,850 | $28,250 |
| 2018 | $2,782 | $41,100 | $12,850 | $28,250 |
| 2017 | $2,699 | $41,100 | $12,850 | $28,250 |
| 2016 | -- | $41,100 | $12,850 | $28,250 |
| 2015 | -- | $41,100 | $12,850 | $28,250 |
| 2014 | -- | $41,100 | $12,850 | $28,250 |
Source: Public Records
Map
Nearby Homes
- 12 W 10th St
- 625 North St
- F1 and F2 Pennsylvania 903
- 521 Oak St
- 518 South St
- 15 W 5th St Unit 17
- 301 Oak St
- 11 E Front St
- 115 South St
- 123 Laurel St
- 740 Raspberry Dr
- A9.02 Pennsylvania 903
- 12 Chestnut Ave
- 224 Center Ave
- 413 South Ave
- 1067 S Broadview Dr
- A591 Apple Lane & Stony Mountain
- 109 W Broadway
- 171 W Broadway
- 394 Flagstaff Rd
Your Personal Tour Guide
Ask me questions while you tour the home.