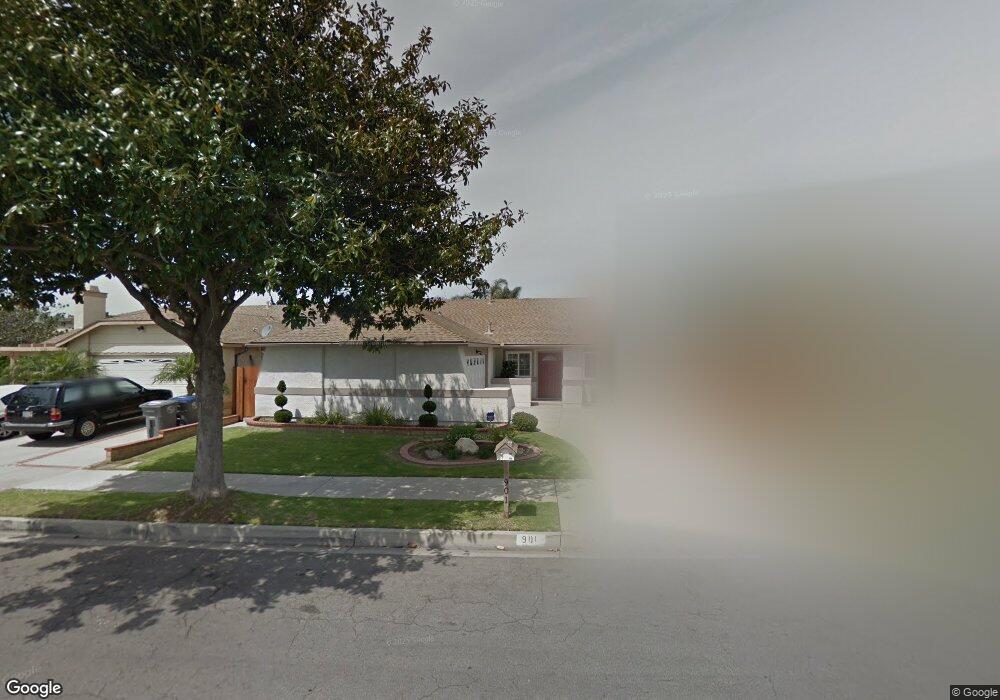
901 Raft Ln Oxnard, CA 93035
Sea Air NeighborhoodEstimated Value: $756,656 - $808,000
2
Beds
2
Baths
1,441
Sq Ft
$547/Sq Ft
Est. Value
About This Home
This home is located at 901 Raft Ln, Oxnard, CA 93035 and is currently estimated at $788,664, approximately $547 per square foot. 901 Raft Ln is a home located in Ventura County with nearby schools including Juan Lagunas Soria Elementary School and Oxnard High School.
Ownership History
Date
Name
Owned For
Owner Type
Purchase Details
Closed on
Jul 29, 1996
Sold by
Sup Park Chang and Hae Jung
Bought by
King Timothy and Borja King Jocelyn B
Current Estimated Value
Home Financials for this Owner
Home Financials are based on the most recent Mortgage that was taken out on this home.
Original Mortgage
$171,870
Outstanding Balance
$13,550
Interest Rate
8.18%
Mortgage Type
VA
Estimated Equity
$775,114
Create a Home Valuation Report for This Property
The Home Valuation Report is an in-depth analysis detailing your home's value as well as a comparison with similar homes in the area
Home Values in the Area
Average Home Value in this Area
Purchase History
| Date | Buyer | Sale Price | Title Company |
|---|---|---|---|
| King Timothy | $169,000 | United Title |
Source: Public Records
Mortgage History
| Date | Status | Borrower | Loan Amount |
|---|---|---|---|
| Open | King Timothy | $171,870 |
Source: Public Records
Tax History
| Year | Tax Paid | Tax Assessment Tax Assessment Total Assessment is a certain percentage of the fair market value that is determined by local assessors to be the total taxable value of land and additions on the property. | Land | Improvement |
|---|---|---|---|---|
| 2025 | $1,280 | $275,185 | $110,071 | $165,114 |
| 2024 | $1,280 | $269,790 | $107,913 | $161,877 |
| 2023 | $1,299 | $264,500 | $105,797 | $158,703 |
| 2022 | $1,356 | $259,314 | $103,722 | $155,592 |
| 2021 | $1,340 | $254,230 | $101,688 | $152,542 |
| 2020 | $3,180 | $251,626 | $100,647 | $150,979 |
| 2019 | $3,091 | $246,693 | $98,674 | $148,019 |
| 2018 | $3,048 | $241,857 | $96,740 | $145,117 |
| 2017 | $2,894 | $237,116 | $94,844 | $142,272 |
| 2016 | $2,794 | $232,468 | $92,985 | $139,483 |
| 2015 | $2,823 | $228,979 | $91,590 | $137,389 |
| 2014 | $2,793 | $224,496 | $89,797 | $134,699 |
Source: Public Records
Map
Nearby Homes
- 676 Snipe Walk
- 2923 Kelp Ln Unit 11
- 600 Freeport Ln
- 2919 Naples Dr
- 2900 Windward Way
- 1170 Windward Way
- 2213 Miramar Walk
- 2324 Miramar Walk
- 1077 Offshore St
- 1309 Nautical Way
- 1501 Pisco Ln
- 1231 Lost Point Ln
- 1174 Oyster Place Unit 15
- 3554 Dunkirk Dr
- 1720 Elsinore Cir
- 807 Kingfisher Way
- 3001 Isle Way Unit B
- 2400 W Hemlock St
- 3746 Dunkirk Dr
- 2783 Bolker Dr
Your Personal Tour Guide
Ask me questions while you tour the home.