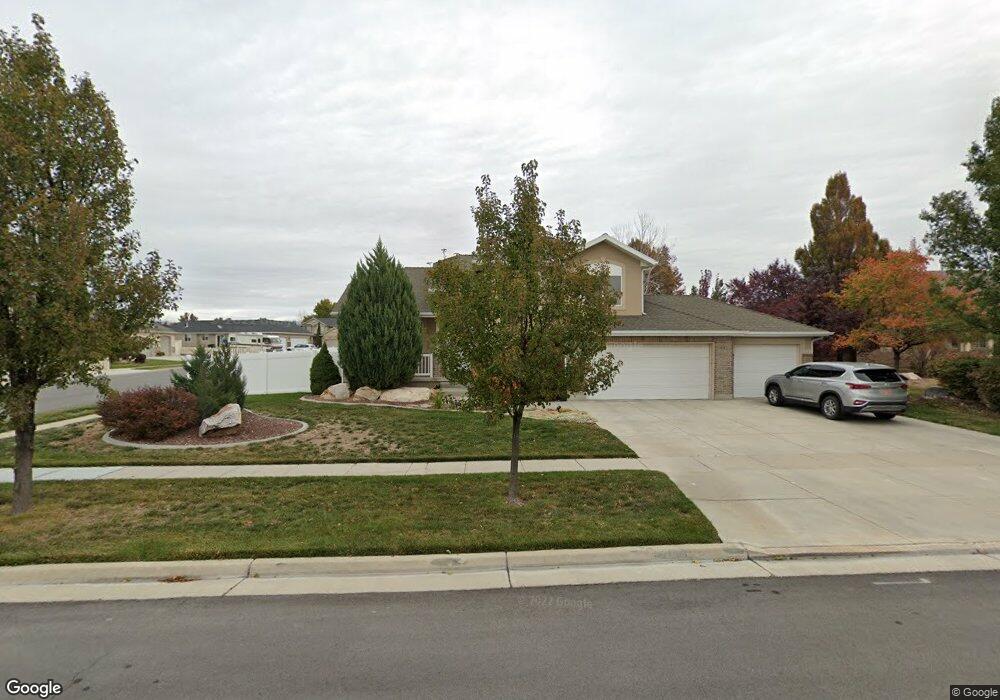
901 S 1760 W Syracuse, UT 84075
Estimated Value: $547,741 - $560,000
3
Beds
3
Baths
2,313
Sq Ft
$239/Sq Ft
Est. Value
About This Home
This home is located at 901 S 1760 W, Syracuse, UT 84075 and is currently estimated at $553,435, approximately $239 per square foot. 901 S 1760 W is a home located in Davis County with nearby schools including Cook School, Syracuse Junior High School, and Syracuse High School.
Ownership History
Date
Name
Owned For
Owner Type
Purchase Details
Closed on
Feb 21, 2007
Sold by
Maass Matthew D and Maass Debbie S
Bought by
Carter Wendee
Current Estimated Value
Home Financials for this Owner
Home Financials are based on the most recent Mortgage that was taken out on this home.
Original Mortgage
$201,100
Outstanding Balance
$120,918
Interest Rate
6.23%
Mortgage Type
Purchase Money Mortgage
Estimated Equity
$432,517
Purchase Details
Closed on
Sep 2, 2003
Sold by
Rich Development Inc
Bought by
Maass Matthew D and Maass Debbie S
Home Financials for this Owner
Home Financials are based on the most recent Mortgage that was taken out on this home.
Original Mortgage
$144,000
Interest Rate
5.87%
Mortgage Type
Purchase Money Mortgage
Purchase Details
Closed on
Aug 5, 2003
Sold by
Symphony Development Corp
Bought by
Rich Development Inc
Home Financials for this Owner
Home Financials are based on the most recent Mortgage that was taken out on this home.
Original Mortgage
$144,000
Interest Rate
5.87%
Mortgage Type
Purchase Money Mortgage
Create a Home Valuation Report for This Property
The Home Valuation Report is an in-depth analysis detailing your home's value as well as a comparison with similar homes in the area
Home Values in the Area
Average Home Value in this Area
Purchase History
| Date | Buyer | Sale Price | Title Company |
|---|---|---|---|
| Carter Wendee | -- | Equity Title Ins Agency Inc | |
| Maass Matthew D | -- | American Preferred Title Llc | |
| Rich Development Inc | -- | Bonneville Title Company Inc |
Source: Public Records
Mortgage History
| Date | Status | Borrower | Loan Amount |
|---|---|---|---|
| Open | Carter Wendee | $201,100 | |
| Previous Owner | Maass Matthew D | $144,000 |
Source: Public Records
Tax History
| Year | Tax Paid | Tax Assessment Tax Assessment Total Assessment is a certain percentage of the fair market value that is determined by local assessors to be the total taxable value of land and additions on the property. | Land | Improvement |
|---|---|---|---|---|
| 2025 | $2,765 | $266,750 | $122,062 | $144,688 |
| 2024 | $2,639 | $256,300 | $104,229 | $152,071 |
| 2023 | $2,576 | $456,000 | $145,040 | $310,960 |
| 2022 | $2,811 | $272,800 | $83,036 | $189,764 |
| 2021 | $2,483 | $373,000 | $123,084 | $249,916 |
| 2020 | $2,180 | $317,000 | $105,568 | $211,432 |
| 2019 | $2,152 | $309,000 | $105,211 | $203,789 |
| 2018 | $1,986 | $283,000 | $100,520 | $182,480 |
| 2016 | $1,750 | $130,790 | $38,507 | $92,283 |
| 2015 | $1,698 | $120,835 | $38,507 | $82,328 |
| 2014 | $1,779 | $129,017 | $38,507 | $90,510 |
| 2013 | -- | $120,878 | $34,667 | $86,211 |
Source: Public Records
Map
Nearby Homes
- 937 S 1600 W
- 1728 Dallas St
- 634 S 1550 W
- 1240 S 1575 W
- 1115 S 1425 W
- 552 S 1525 W
- 2098 W 700 S
- 1437 W 1200 S
- 1443 W 550 S
- 615 S 1400 W
- 1354 W 1200 S
- 1413 S David St
- 1720 W 1400 S
- 1202 W 1100 S
- 1130 W 1045 S
- 2584 S 2430 St W Unit 502
- 2613 S 2430 W Unit 111
- 2614 S 2430 W Unit 106
- 2665 S 2430 W Unit 118
- 2663 S 2430 W
- 909 S 1760 W
- 1719 Heritage Parkway Ln
- 848 Banbury Dr
- 876 Banbury Dr
- 1746 Heritage Pkwy
- 1728 Heritage Pkwy
- 1779 Heritage Pkwy
- 1760 Heritage Pkwy
- 917 S 1760 W
- 808 Banbury Dr
- 902 Banbury Dr
- 1516 S 1740 W
- 1776 Heritage Pkwy
- 1719 Heritage Pkwy
- 1744 W 775 S Unit 16
- 843 Banbury Dr
- 1753 W 775 S
- 798 Banbury Dr
- 922 S 1760 W
- 922 S 1760 W Unit 17
Your Personal Tour Guide
Ask me questions while you tour the home.