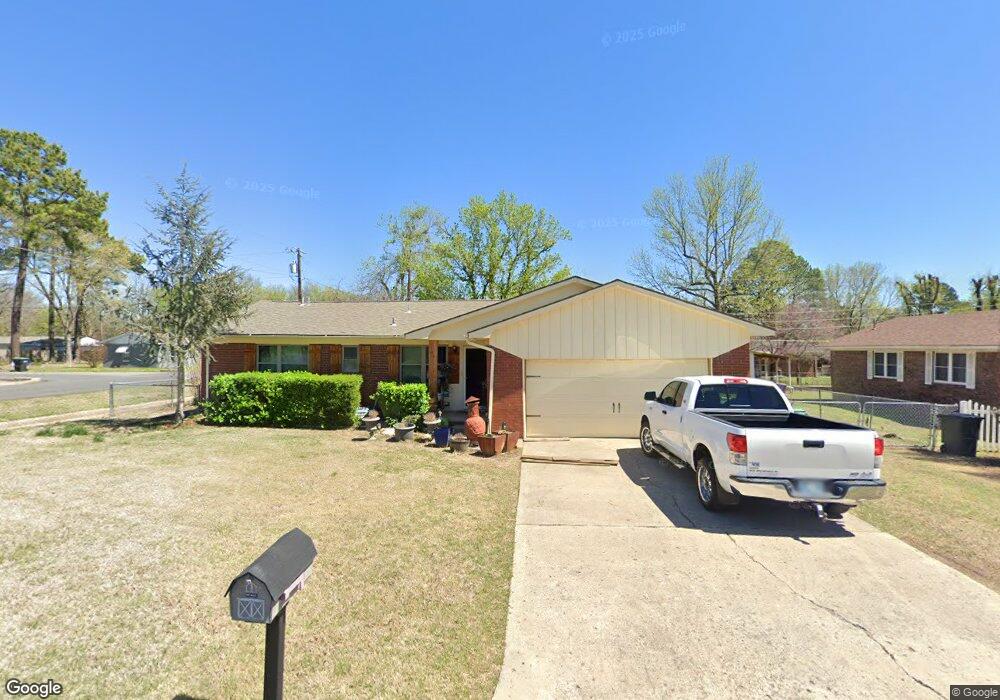
901 S Mission Ave Tahlequah, OK 74464
Estimated Value: $139,292 - $200,000
3
Beds
2
Baths
1,584
Sq Ft
$109/Sq Ft
Est. Value
About This Home
This home is located at 901 S Mission Ave, Tahlequah, OK 74464 and is currently estimated at $172,573, approximately $108 per square foot. 901 S Mission Ave is a home located in Cherokee County with nearby schools including Greenwood Elementary School, Cherokee Elementary School, and Tahlequah Middle School.
Ownership History
Date
Name
Owned For
Owner Type
Purchase Details
Closed on
Nov 19, 2021
Sold by
Boer Dana S and Boren Boer Dana
Bought by
Boren Boer Dana S
Current Estimated Value
Home Financials for this Owner
Home Financials are based on the most recent Mortgage that was taken out on this home.
Original Mortgage
$116,000
Outstanding Balance
$98,149
Interest Rate
3.09%
Mortgage Type
New Conventional
Estimated Equity
$74,424
Purchase Details
Closed on
Nov 28, 2005
Sold by
Ray Kenneth D and Ray Janet L
Bought by
Cope Joe D and Cope Cathy S
Home Financials for this Owner
Home Financials are based on the most recent Mortgage that was taken out on this home.
Original Mortgage
$17,000
Interest Rate
6.04%
Mortgage Type
Purchase Money Mortgage
Purchase Details
Closed on
Sep 5, 2001
Sold by
Mark and Reiko Clark
Bought by
Kenneth and Janet Ray
Purchase Details
Closed on
Dec 30, 1996
Sold by
Rountree
Bought by
Clark
Purchase Details
Closed on
Oct 28, 1993
Sold by
Josie B Adair
Bought by
Jeanne Mark A and Jeanne Rountree
Create a Home Valuation Report for This Property
The Home Valuation Report is an in-depth analysis detailing your home's value as well as a comparison with similar homes in the area
Home Values in the Area
Average Home Value in this Area
Purchase History
| Date | Buyer | Sale Price | Title Company |
|---|---|---|---|
| Boren Boer Dana S | -- | Integrity Title & Closing | |
| Cope Joe D | $85,000 | Cherokee Capitol Closing Ser | |
| Kenneth | $69,000 | -- | |
| Clark | $62,000 | -- | |
| Jeanne Mark A | $48,000 | -- |
Source: Public Records
Mortgage History
| Date | Status | Borrower | Loan Amount |
|---|---|---|---|
| Open | Boren Boer Dana S | $116,000 | |
| Closed | Cope Joe D | $17,000 |
Source: Public Records
Tax History Compared to Growth
Tax History
| Year | Tax Paid | Tax Assessment Tax Assessment Total Assessment is a certain percentage of the fair market value that is determined by local assessors to be the total taxable value of land and additions on the property. | Land | Improvement |
|---|---|---|---|---|
| 2025 | $1,140 | $12,210 | $2,750 | $9,460 |
| 2024 | $1,187 | $12,523 | $2,750 | $9,773 |
| 2023 | $1,187 | $12,018 | $1,210 | $10,808 |
| 2022 | $1,115 | $12,018 | $1,210 | $10,808 |
| 2021 | $1,119 | $12,018 | $1,210 | $10,808 |
| 2020 | $1,125 | $11,863 | $1,210 | $10,653 |
| 2019 | $1,062 | $11,298 | $1,210 | $10,088 |
| 2018 | $1,023 | $10,759 | $1,210 | $9,549 |
| 2017 | $1,021 | $10,759 | $1,210 | $9,549 |
| 2016 | $979 | $10,258 | $1,210 | $9,048 |
| 2015 | $1,108 | $9,769 | $1,210 | $8,559 |
| 2014 | $1,108 | $11,770 | $1,210 | $10,560 |
Source: Public Records
Map
Nearby Homes
- 902 S Mission Ave
- 902 S Owens Ave
- 802 S College Ave
- 516 W Fox St
- 513 S State Ave
- 1104 Chase Ave
- 510 S Cherokee Ave
- 1025 W Fox St
- 757 S Bluff Ave
- 306 Short St
- 224 W Chickasaw St
- 201 Sandy Cir
- 0 W Choctaw St
- 807 W Choctaw St
- 702 Wilson Ave
- 813 W Choctaw St
- Tbd Unit West Fox Street Tahl
- 413 Greenwood Dr
- 1105 S Maple Ave
- 610 W Delaware St
- 903 S Mission Ave
- 500 W 1st St
- 900 Lamer Ave
- 904 Lamer Ave
- 900 S Mission Ave
- 905 S Mission Ave
- 906 Lamer Ave
- 904 S Mission Ave
- 815 S Mission Ave
- 807 S Mission Ave
- 907 S Mission Ave
- 502 W 1st St
- 901 Lamer Ave
- 908 Lamer Ave
- 907 Lamer Ave
- 859 Lamer Ave
- 846 Lamer Ave
- 824 Lamer Ave
- 906 S Mission Ave
- 901 Shelley Cir