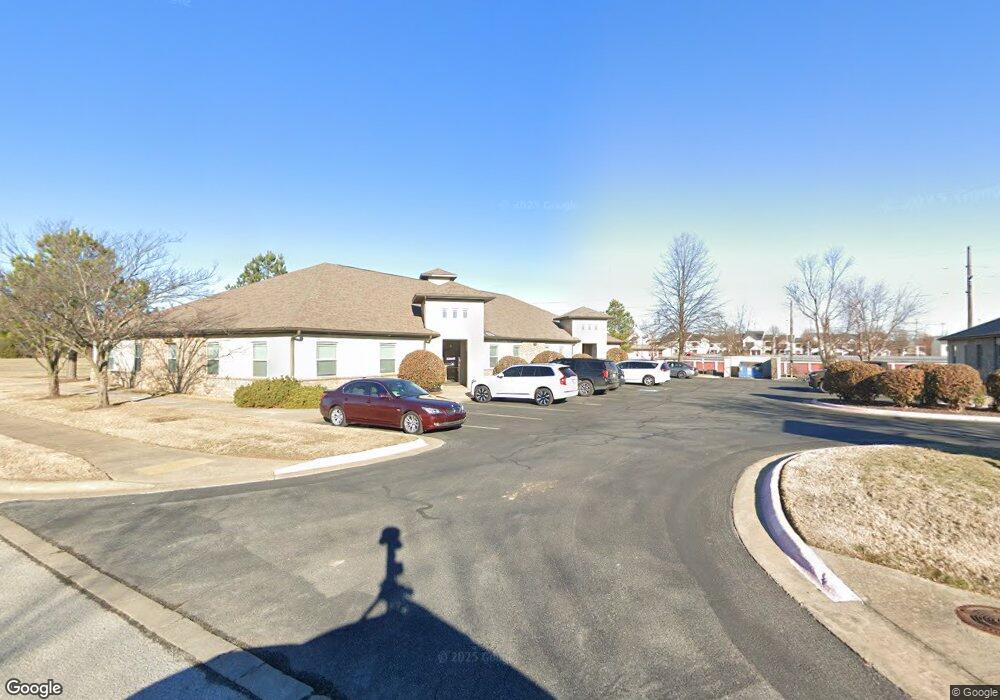
901 SE Village Loop Bentonville, AR 72712
Estimated Value: $6,818,463
--
Bed
--
Bath
8,056
Sq Ft
$846/Sq Ft
Est. Value
About This Home
This home is located at 901 SE Village Loop, Bentonville, AR 72712 and is currently estimated at $6,818,463, approximately $846 per square foot. 901 SE Village Loop is a home located in Benton County with nearby schools including Ruth Barker Middle School, Mary Mae Jones Elementary School, and Fulbright Junior High School.
Ownership History
Date
Name
Owned For
Owner Type
Purchase Details
Closed on
Nov 7, 2019
Sold by
Kndw Investments Llc
Bought by
12M Commercial Properties Llc
Current Estimated Value
Home Financials for this Owner
Home Financials are based on the most recent Mortgage that was taken out on this home.
Original Mortgage
$2,677,500
Outstanding Balance
$773,014
Interest Rate
3.6%
Mortgage Type
Purchase Money Mortgage
Estimated Equity
$6,045,449
Purchase Details
Closed on
Sep 12, 2012
Sold by
Bentley Ward Tami J and Bentley Wallis
Bought by
Bentley Montgomery Tami J and Bentley Wallis
Purchase Details
Closed on
Jun 22, 2007
Sold by
Cottonwood Development Co Llc
Bought by
Renaissance Investments Inc
Home Financials for this Owner
Home Financials are based on the most recent Mortgage that was taken out on this home.
Original Mortgage
$2,400,000
Interest Rate
6.37%
Mortgage Type
Construction
Create a Home Valuation Report for This Property
The Home Valuation Report is an in-depth analysis detailing your home's value as well as a comparison with similar homes in the area
Home Values in the Area
Average Home Value in this Area
Purchase History
| Date | Buyer | Sale Price | Title Company |
|---|---|---|---|
| 12M Commercial Properties Llc | $3,150,000 | None Available | |
| Bentley Montgomery Tami J | -- | None Available | |
| Renaissance Investments Inc | $544,000 | Pinnacle Title Llc |
Source: Public Records
Mortgage History
| Date | Status | Borrower | Loan Amount |
|---|---|---|---|
| Open | 12M Commercial Properties Llc | $2,677,500 | |
| Previous Owner | Renaissance Investments Inc | $2,400,000 |
Source: Public Records
Tax History Compared to Growth
Tax History
| Year | Tax Paid | Tax Assessment Tax Assessment Total Assessment is a certain percentage of the fair market value that is determined by local assessors to be the total taxable value of land and additions on the property. | Land | Improvement |
|---|---|---|---|---|
| 2025 | $51,535 | $1,098,687 | $176,336 | $922,351 |
| 2024 | $47,455 | $1,098,687 | $176,336 | $922,351 |
| 2023 | $43,141 | $698,070 | $105,700 | $592,370 |
| 2022 | $44,188 | $698,070 | $105,700 | $592,370 |
| 2021 | $44,041 | $698,070 | $105,700 | $592,370 |
| 2020 | $42,943 | $674,140 | $89,560 | $584,580 |
| 2019 | $42,943 | $674,140 | $89,560 | $584,580 |
| 2018 | $42,943 | $674,140 | $89,560 | $584,580 |
| 2017 | $41,594 | $674,140 | $89,560 | $584,580 |
| 2016 | $41,594 | $674,140 | $89,560 | $584,580 |
| 2015 | $39,881 | $645,320 | $122,530 | $522,790 |
| 2014 | $39,881 | $645,320 | $122,530 | $522,790 |
Source: Public Records
Map
Nearby Homes
- 903 SE Village Loop Unit 5
- 903 SE Village Loop Unit 2
- 903 SE Village Loop
- 900 SE Village Loop
- 905 SE Village Loop
- 905 SE Village Loop Unit 3
- 805 SE 22nd St
- 907 SE Village Loop Unit 3
- 0 SE 22nd St
- 903 SE 21st St
- 901 SE 22nd St Unit 1
- 905 SE 21st St
- 903 SE 22nd St
- 903 SE 22nd St Unit 3 A & B
- 903 SE 22nd St Unit 3A
- 903 SE 22nd St Unit 3B
- 907 SE 21st St Unit 2
- 907 SE 21st St Unit 1
- 907 SE 21st St
- 908 SE 21st St