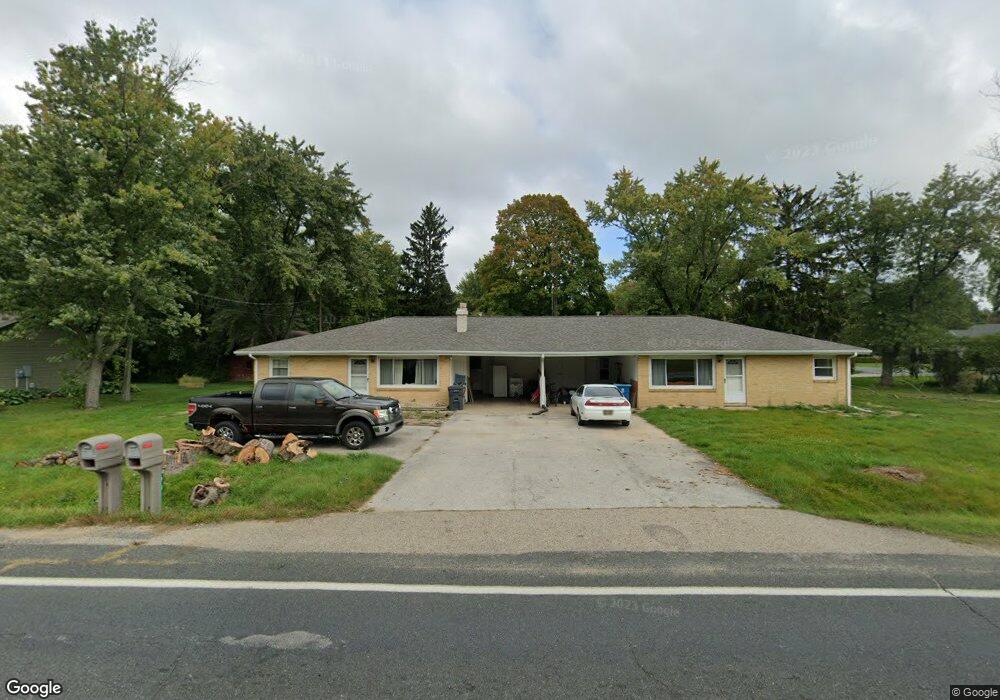
901 W Glenlord Rd Saint Joseph, MI 49085
Estimated Value: $303,000 - $442,000
2
Beds
1
Bath
2,836
Sq Ft
$129/Sq Ft
Est. Value
About This Home
This home is located at 901 W Glenlord Rd, Saint Joseph, MI 49085 and is currently estimated at $365,961, approximately $129 per square foot. 901 W Glenlord Rd is a home located in Berrien County with nearby schools including Upton Middle School, St. Joseph High School, and Michigan Lutheran High School.
Ownership History
Date
Name
Owned For
Owner Type
Purchase Details
Closed on
Aug 21, 2023
Sold by
Pazder Ann Michelle
Bought by
Gagliardo Jordan
Current Estimated Value
Home Financials for this Owner
Home Financials are based on the most recent Mortgage that was taken out on this home.
Original Mortgage
$218,000
Outstanding Balance
$213,033
Interest Rate
6.81%
Mortgage Type
New Conventional
Estimated Equity
$152,928
Purchase Details
Closed on
Nov 20, 2017
Sold by
Gagliano Michael
Bought by
Pazder Michelle
Purchase Details
Closed on
Dec 6, 2016
Sold by
Gagliardo Michael
Bought by
Gagliardo Ann Michelle and Gagliardo Michael John
Purchase Details
Closed on
Apr 23, 2003
Sold by
Lange Patricia M and Lange Edward F
Bought by
Gagliardo Michael
Home Financials for this Owner
Home Financials are based on the most recent Mortgage that was taken out on this home.
Original Mortgage
$89,400
Interest Rate
5.86%
Mortgage Type
Purchase Money Mortgage
Create a Home Valuation Report for This Property
The Home Valuation Report is an in-depth analysis detailing your home's value as well as a comparison with similar homes in the area
Home Values in the Area
Average Home Value in this Area
Purchase History
| Date | Buyer | Sale Price | Title Company |
|---|---|---|---|
| Gagliardo Jordan | $240,000 | None Listed On Document | |
| Pazder Michelle | -- | None Available | |
| Gagliardo Ann Michelle | -- | Attorney | |
| Gagliardo Michael | $157,900 | -- |
Source: Public Records
Mortgage History
| Date | Status | Borrower | Loan Amount |
|---|---|---|---|
| Open | Gagliardo Jordan | $218,000 | |
| Previous Owner | Gagliardo Michael | $89,400 |
Source: Public Records
Tax History Compared to Growth
Tax History
| Year | Tax Paid | Tax Assessment Tax Assessment Total Assessment is a certain percentage of the fair market value that is determined by local assessors to be the total taxable value of land and additions on the property. | Land | Improvement |
|---|---|---|---|---|
| 2025 | $4,073 | $130,800 | $0 | $0 |
| 2024 | $2,672 | $118,600 | $0 | $0 |
| 2023 | $1,944 | $107,000 | $0 | $0 |
| 2022 | $1,851 | $86,000 | $0 | $0 |
| 2021 | $2,278 | $81,600 | $14,700 | $66,900 |
| 2020 | $2,249 | $76,100 | $0 | $0 |
| 2019 | $2,119 | $69,000 | $13,400 | $55,600 |
| 2018 | $2,109 | $69,000 | $0 | $0 |
| 2017 | $2,074 | $58,100 | $0 | $0 |
| 2016 | $1,986 | $56,200 | $0 | $0 |
| 2015 | $1,960 | $56,100 | $0 | $0 |
| 2014 | $1,579 | $54,900 | $0 | $0 |
Source: Public Records
Map
Nearby Homes
- 1153 W Glenlord Rd Unit 22
- 1332 W Glenlord Rd
- 484 W Glenlord Rd
- 792 Lonesome Pine Trail
- 4111 Hailey Dr
- 1373 Saint Joseph Cir
- Elements 2100 Plan at Marquette Woods
- Elements 1870 Plan at Marquette Woods
- Elements 2390 Plan at Marquette Woods
- Integrity 1880 Plan at Marquette Woods
- Integrity 1610 Plan at Marquette Woods
- Traditions 1600 V8.0b Plan at Marquette Woods
- Integrity 1830 Plan at Marquette Woods
- Integrity 1530 Plan at Marquette Woods
- Elements 2090 Plan at Marquette Woods
- Integrity 2080 Plan at Marquette Woods
- Integrity 1520 Plan at Marquette Woods
- Traditions 2350 V8.0b Plan at Marquette Woods
- Traditions 3100 Plan at Marquette Woods
- Integrity 2000 Plan at Marquette Woods
- 901 W Glenlord Rd
- 4070 Lincoln Ave
- 4093 Lincoln Ave
- 4059 Lincoln Ave
- 4048 Lincoln Ave
- 955 W Glenlord Rd
- 971 W Glenlord Rd
- 4035 Lincoln Ave
- 880 W Glenlord Rd
- 4018 Lincoln Ave
- 980 W Glenlord Rd
- 991 W Glenlord Rd
- 4165 Lincoln Ave
- 3994 Lincoln Ave
- 4216 Lincoln Ave
- 1017 W Glenlord Rd
- 3976 Lincoln Ave
- 4037 Meadow Ln
- 1030 W Glenlord Rd
- 4220 Lincoln Ave