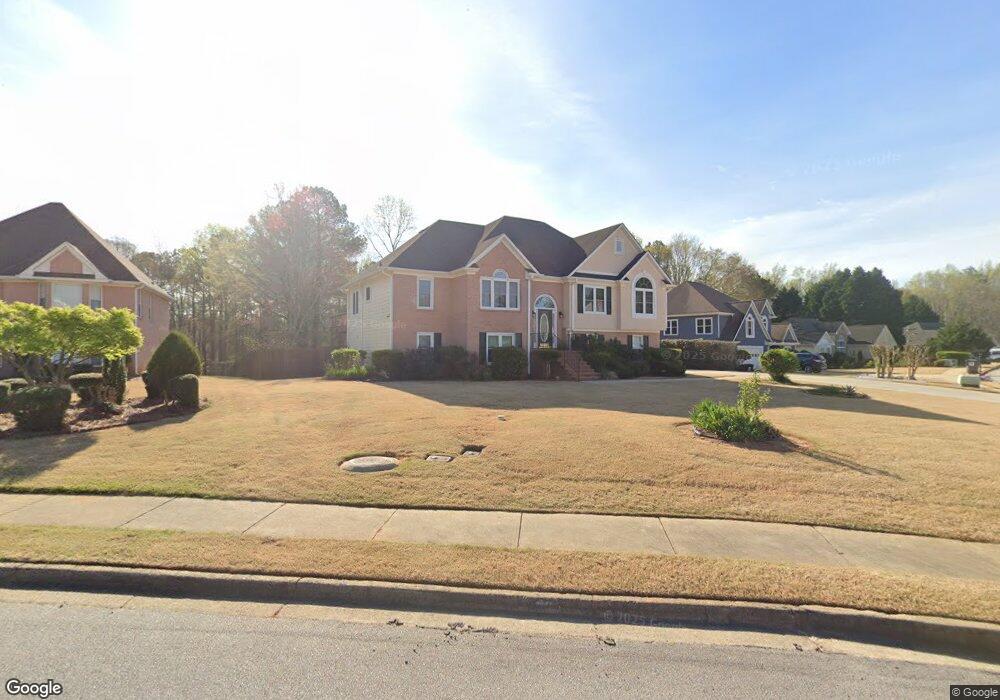
901 Windmill Ct Jonesboro, GA 30236
Estimated Value: $295,979 - $314,000
3
Beds
2
Baths
1,848
Sq Ft
$166/Sq Ft
Est. Value
About This Home
This home is located at 901 Windmill Ct, Jonesboro, GA 30236 and is currently estimated at $307,495, approximately $166 per square foot. 901 Windmill Ct is a home located in Henry County with nearby schools including Red Oak Elementary School, Dutchtown Middle School, and Dutchtown High School.
Ownership History
Date
Name
Owned For
Owner Type
Purchase Details
Closed on
Jun 21, 2019
Sold by
Erves Lizzie Vernel
Bought by
Erves Alonzo
Current Estimated Value
Purchase Details
Closed on
Feb 6, 2002
Sold by
Erves Lizzie V
Bought by
Erves Alonzo and Erves Lizzie V
Home Financials for this Owner
Home Financials are based on the most recent Mortgage that was taken out on this home.
Original Mortgage
$126,000
Interest Rate
7.02%
Mortgage Type
New Conventional
Purchase Details
Closed on
Apr 21, 1997
Sold by
Mcmillan Mcdonald Builders
Bought by
Erves Alonzo and Erves Lizzie
Home Financials for this Owner
Home Financials are based on the most recent Mortgage that was taken out on this home.
Original Mortgage
$123,722
Interest Rate
7.86%
Mortgage Type
FHA
Purchase Details
Closed on
Dec 6, 1996
Sold by
Rel Prop
Bought by
Mcmillanmcdonald Bldrs
Create a Home Valuation Report for This Property
The Home Valuation Report is an in-depth analysis detailing your home's value as well as a comparison with similar homes in the area
Home Values in the Area
Average Home Value in this Area
Purchase History
| Date | Buyer | Sale Price | Title Company |
|---|---|---|---|
| Erves Alonzo | -- | -- | |
| Erves Alonzo | -- | -- | |
| Erves Alonzo | $143,400 | -- | |
| Mcmillanmcdonald Bldrs | $23,000 | -- |
Source: Public Records
Mortgage History
| Date | Status | Borrower | Loan Amount |
|---|---|---|---|
| Previous Owner | Erves Alonzo | $126,000 | |
| Previous Owner | Erves Alonzo | $123,722 |
Source: Public Records
Tax History Compared to Growth
Tax History
| Year | Tax Paid | Tax Assessment Tax Assessment Total Assessment is a certain percentage of the fair market value that is determined by local assessors to be the total taxable value of land and additions on the property. | Land | Improvement |
|---|---|---|---|---|
| 2025 | $1,439 | $118,000 | $16,000 | $102,000 |
| 2024 | $1,439 | $122,280 | $16,000 | $106,280 |
| 2023 | $1,220 | $127,720 | $14,000 | $113,720 |
| 2022 | $773 | $99,400 | $14,000 | $85,400 |
| 2021 | $773 | $78,840 | $14,000 | $64,840 |
| 2020 | $773 | $70,640 | $10,000 | $60,640 |
| 2019 | $74 | $68,760 | $10,000 | $58,760 |
| 2018 | $773 | $65,120 | $10,000 | $55,120 |
| 2016 | $698 | $57,360 | $10,000 | $47,360 |
| 2015 | $607 | $48,600 | $8,000 | $40,600 |
| 2014 | $497 | $40,960 | $6,000 | $34,960 |
Source: Public Records
Map
Nearby Homes
- 1009 Chads Ridge
- 617 Creekstone Ct
- 182 Spivey Glen Dr
- 224 Reeves Creek Way
- 1137 Baileys Ct
- 3139 Players Dr
- 733 Berkeley Dr
- 732 Berkeley Dr
- 717 Berkeley Dr
- 706 Berkeley Dr
- 708 Berkeley Dr
- 725 Berkeley Dr
- 710 Berkeley Dr
- 745 Berkeley Dr
- 722 Berkeley Dr
- 718 Berkeley Dr
- 719 Berkeley Dr
- 712 Berkeley Dr
- 734 Berkeley Dr
- 702 Berkeley Dr
- 469 Emerald Trace
- 905 Windmill Ct
- 459 Emerald Trace
- 468 Emerald Trace
- 909 Windmill Ct
- 473 Emerald Trace Unit 524
- 473 Emerald Trace
- 0 Windmill Ct
- 1001 Chads Ridge
- 474 Emerald Trace
- 455 Emerald Trace
- 915 Windmill Ct
- 910 Windmill Ct
- 477 Emerald Trace
- 1005 Chads Ridge
- 1010 Chads Ridge Unit 1010
- 1010 Chads Ridge
- 480 Emerald Trace
- 919 Windmill Ct
- 451 Emerald Trace