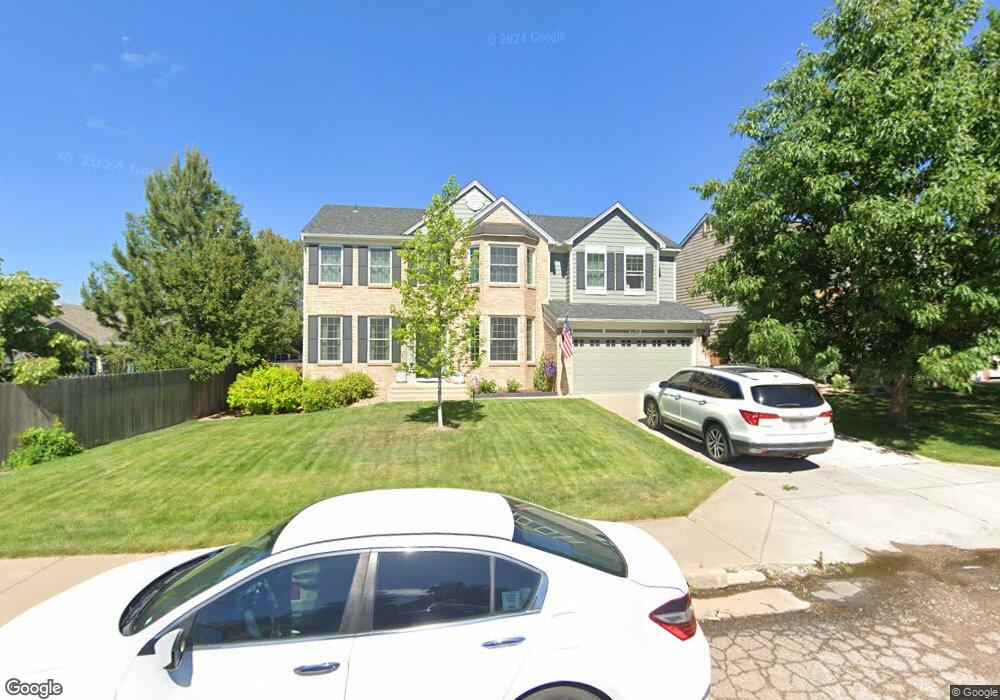
9010 Musgrave St Colorado Springs, CO 80920
Briargate NeighborhoodEstimated Value: $576,519 - $665,000
5
Beds
4
Baths
2,504
Sq Ft
$250/Sq Ft
Est. Value
About This Home
This home is located at 9010 Musgrave St, Colorado Springs, CO 80920 and is currently estimated at $626,880, approximately $250 per square foot. 9010 Musgrave St is a home located in El Paso County with nearby schools including Explorer Elementary School, Timberview Middle School, and Liberty High School.
Ownership History
Date
Name
Owned For
Owner Type
Purchase Details
Closed on
Nov 12, 2013
Sold by
Frankmore Gino L
Bought by
Lanning Erik B and Lanning Tangi M
Current Estimated Value
Home Financials for this Owner
Home Financials are based on the most recent Mortgage that was taken out on this home.
Original Mortgage
$347,412
Outstanding Balance
$259,595
Interest Rate
4.28%
Mortgage Type
VA
Estimated Equity
$367,285
Purchase Details
Closed on
Jan 16, 2012
Sold by
Frankmore Gino L and Frankmore Tracy A
Bought by
Frankmore Gino L
Purchase Details
Closed on
Apr 28, 1999
Sold by
Richmond American Homes Of Colorado Inc
Bought by
Frankmore Gino L and Frankmore Tracy A
Home Financials for this Owner
Home Financials are based on the most recent Mortgage that was taken out on this home.
Original Mortgage
$191,000
Interest Rate
7.07%
Purchase Details
Closed on
Mar 1, 1987
Bought by
Lanning Tangi M
Create a Home Valuation Report for This Property
The Home Valuation Report is an in-depth analysis detailing your home's value as well as a comparison with similar homes in the area
Home Values in the Area
Average Home Value in this Area
Purchase History
| Date | Buyer | Sale Price | Title Company |
|---|---|---|---|
| Lanning Erik B | $340,100 | None Available | |
| Frankmore Gino L | -- | None Available | |
| Frankmore Gino L | $215,903 | Land Title | |
| Lanning Tangi M | -- | -- |
Source: Public Records
Mortgage History
| Date | Status | Borrower | Loan Amount |
|---|---|---|---|
| Open | Lanning Erik B | $347,412 | |
| Previous Owner | Frankmore Gino L | $191,000 |
Source: Public Records
Tax History Compared to Growth
Tax History
| Year | Tax Paid | Tax Assessment Tax Assessment Total Assessment is a certain percentage of the fair market value that is determined by local assessors to be the total taxable value of land and additions on the property. | Land | Improvement |
|---|---|---|---|---|
| 2025 | $2,493 | $41,200 | -- | -- |
| 2024 | $2,467 | $42,500 | $6,700 | $35,800 |
| 2022 | $2,121 | $30,050 | $5,420 | $24,630 |
| 2021 | $2,346 | $30,920 | $5,580 | $25,340 |
| 2020 | $2,322 | $28,530 | $4,650 | $23,880 |
| 2019 | $2,299 | $28,530 | $4,650 | $23,880 |
| 2018 | $1,976 | $24,120 | $3,600 | $20,520 |
| 2017 | $1,969 | $24,120 | $3,600 | $20,520 |
| 2016 | $2,144 | $26,230 | $3,660 | $22,570 |
| 2015 | $2,140 | $26,230 | $3,660 | $22,570 |
| 2014 | $2,020 | $24,750 | $3,660 | $21,090 |
Source: Public Records
Map
Nearby Homes
- 4405 Kashmire Dr
- 4545 Bays Water Dr
- 4652 Kashmire Dr
- 4658 Kashmire Dr
- 4585 Kashmire Dr
- 9247 Prairie Clover Dr
- 3925 Zurich Dr
- 8674 Bellcove Cir
- 8845 Nantucket Ct
- 9075 Bellcove Cir
- 8735 Quail Glen Dr
- 3830 Cottage Dr
- 5019 Petrified Forest Trail
- 9045 Aldersgate Ct
- 4940 Deviation Point
- 5064 Construct Point
- 4145 Thundercloud Dr
- 8482 Artesian Springs Point
- 5049 Construct Point
- 5071 Farris Creek Ct
- 9018 Musgrave St
- 4440 Bays Water Dr
- 4430 Bays Water Dr
- 9026 Musgrave St
- 9025 Brainard Dr
- 9035 Brainard Dr
- 9017 Musgrave St
- 9019 Musgrave St
- 9034 Musgrave St
- 9009 Musgrave St
- 9045 Brainard Dr
- 4410 Bays Water Dr
- 9001 Musgrave St
- 9027 Musgrave St
- 9055 Brainard Dr
- 9035 Musgrave St
- 4445 Bays Water Dr
- 9042 Musgrave St
- 4435 Bays Water Dr
- 4449 Bays Water Dr