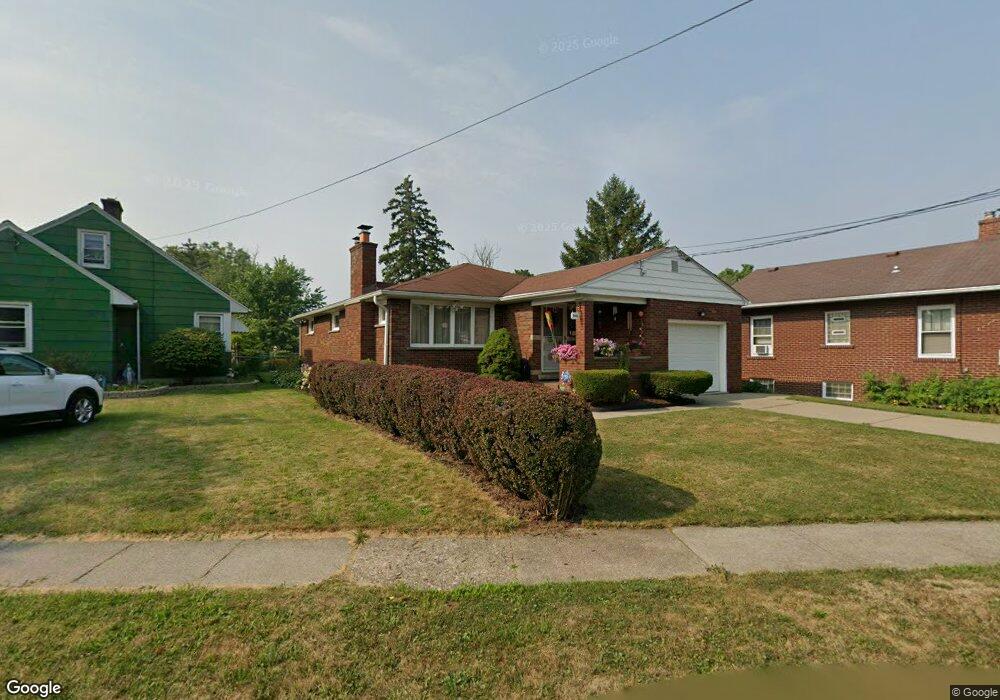
9011 Brookside Dr Niagara Falls, NY 14304
LaSalle NeighborhoodEstimated Value: $169,000 - $210,538
2
Beds
1
Bath
1,240
Sq Ft
$158/Sq Ft
Est. Value
About This Home
This home is located at 9011 Brookside Dr, Niagara Falls, NY 14304 and is currently estimated at $195,385, approximately $157 per square foot. 9011 Brookside Dr is a home located in Niagara County with nearby schools including Niagara Falls High School, Christ the King Preparatory Academy, and Catholic Academy Of Niagara Falls - Elementary.
Ownership History
Date
Name
Owned For
Owner Type
Purchase Details
Closed on
May 1, 2012
Sold by
T-Le Lein Herta
Bought by
Webber Christina T
Current Estimated Value
Purchase Details
Closed on
Dec 9, 2008
Sold by
Lein Herta T
Bought by
Webber Christine Johnson Carol
Purchase Details
Closed on
Apr 29, 2008
Sold by
Lein Herta T
Bought by
Webber Christine Johnson Carol
Purchase Details
Closed on
Dec 16, 1994
Sold by
Mcdonald Robert M
Bought by
Lein Herta T
Create a Home Valuation Report for This Property
The Home Valuation Report is an in-depth analysis detailing your home's value as well as a comparison with similar homes in the area
Home Values in the Area
Average Home Value in this Area
Purchase History
| Date | Buyer | Sale Price | Title Company |
|---|---|---|---|
| Webber Christina T | -- | Alfonso Bax | |
| Webber Christine Johnson Carol | -- | Alfonso Bax | |
| Webber Christine Johnson Carol | -- | Alfonso Bax | |
| Lein Herta T | $83,900 | -- |
Source: Public Records
Tax History Compared to Growth
Tax History
| Year | Tax Paid | Tax Assessment Tax Assessment Total Assessment is a certain percentage of the fair market value that is determined by local assessors to be the total taxable value of land and additions on the property. | Land | Improvement |
|---|---|---|---|---|
| 2024 | $2,214 | $75,600 | $4,800 | $70,800 |
| 2023 | $2,214 | $75,600 | $4,800 | $70,800 |
| 2022 | $1,786 | $75,600 | $4,800 | $70,800 |
| 2021 | $1,786 | $75,600 | $4,800 | $70,800 |
| 2020 | $1,786 | $75,600 | $4,800 | $70,800 |
| 2019 | $1,408 | $75,600 | $4,800 | $70,800 |
| 2018 | $1,408 | $75,600 | $4,800 | $70,800 |
| 2017 | $1,408 | $75,600 | $4,800 | $70,800 |
| 2016 | $3,036 | $75,600 | $4,800 | $70,800 |
| 2015 | -- | $75,600 | $4,800 | $70,800 |
| 2014 | -- | $75,600 | $4,800 | $70,800 |
Source: Public Records
Map
Nearby Homes