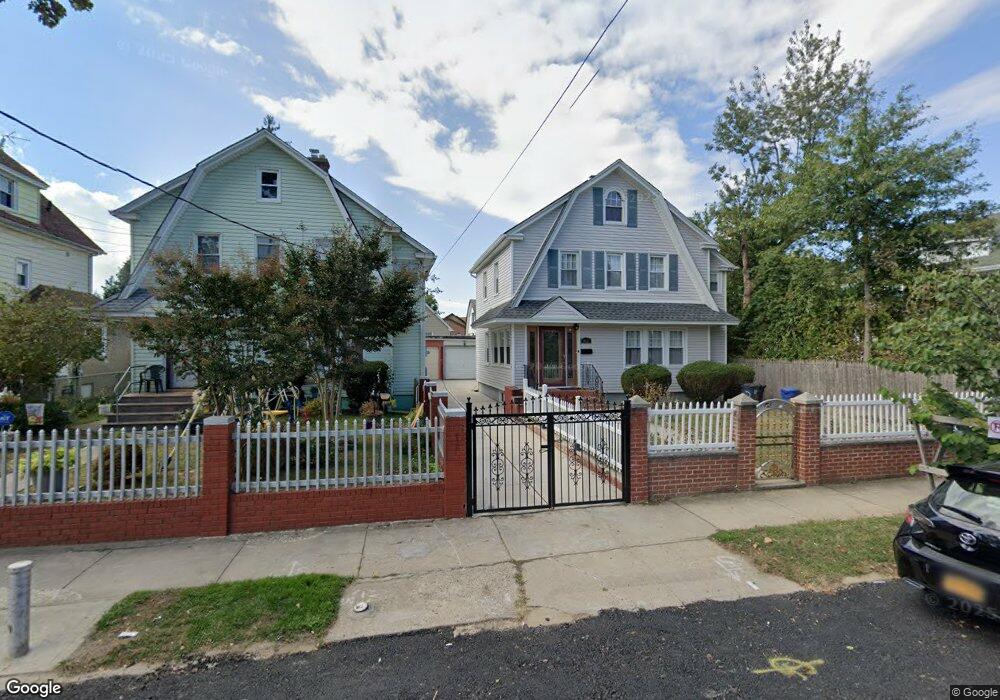
9012 188th St Hollis, NY 11423
Hollis NeighborhoodEstimated Value: $758,000 - $920,000
--
Bed
--
Bath
1,439
Sq Ft
$567/Sq Ft
Est. Value
About This Home
This home is located at 9012 188th St, Hollis, NY 11423 and is currently estimated at $815,464, approximately $566 per square foot. 9012 188th St is a home located in Queens County with nearby schools including P.S. 35 Nathaniel Woodhull, I.S. 238 Susan B Anthony Academy, and Wellspring Elementary & Middle.
Ownership History
Date
Name
Owned For
Owner Type
Purchase Details
Closed on
Feb 17, 2015
Sold by
Sky Development Corp
Bought by
Islam Mohammad S
Current Estimated Value
Home Financials for this Owner
Home Financials are based on the most recent Mortgage that was taken out on this home.
Original Mortgage
$372,000
Outstanding Balance
$283,869
Interest Rate
3.66%
Mortgage Type
New Conventional
Estimated Equity
$531,595
Purchase Details
Closed on
Sep 15, 2012
Sold by
Liu Jian
Bought by
Sky Development Corp
Purchase Details
Closed on
Aug 20, 2002
Sold by
Tants Patricia Curcio and Ervolino Eileen
Bought by
A & Matt Properties Inc
Home Financials for this Owner
Home Financials are based on the most recent Mortgage that was taken out on this home.
Original Mortgage
$220,000
Interest Rate
6.27%
Purchase Details
Closed on
Aug 29, 2001
Sold by
Galvin Mary T
Bought by
Tants Patricia Curcio and Ervolino Eileen
Create a Home Valuation Report for This Property
The Home Valuation Report is an in-depth analysis detailing your home's value as well as a comparison with similar homes in the area
Home Values in the Area
Average Home Value in this Area
Purchase History
| Date | Buyer | Sale Price | Title Company |
|---|---|---|---|
| Islam Mohammad S | $465,000 | -- | |
| Sky Development Corp | $354,360 | -- | |
| A & Matt Properties Inc | -- | -- | |
| Tants Patricia Curcio | -- | -- |
Source: Public Records
Mortgage History
| Date | Status | Borrower | Loan Amount |
|---|---|---|---|
| Open | Islam Mohammad S | $372,000 | |
| Previous Owner | A & Matt Properties Inc | $220,000 |
Source: Public Records
Tax History Compared to Growth
Tax History
| Year | Tax Paid | Tax Assessment Tax Assessment Total Assessment is a certain percentage of the fair market value that is determined by local assessors to be the total taxable value of land and additions on the property. | Land | Improvement |
|---|---|---|---|---|
| 2025 | $6,716 | $35,446 | $12,050 | $23,396 |
| 2024 | $6,716 | $33,440 | $12,481 | $20,959 |
| 2023 | $6,541 | $32,566 | $10,962 | $21,604 |
| 2022 | $4,769 | $42,900 | $14,400 | $28,500 |
| 2021 | $6,589 | $36,300 | $14,400 | $21,900 |
| 2020 | $6,253 | $32,760 | $14,400 | $18,360 |
| 2019 | $5,830 | $32,880 | $14,400 | $18,480 |
| 2018 | $5,532 | $27,138 | $11,693 | $15,445 |
| 2017 | $5,410 | $26,541 | $12,564 | $13,977 |
| 2016 | $5,216 | $26,541 | $12,564 | $13,977 |
| 2015 | $3,020 | $24,616 | $13,468 | $11,148 |
| 2014 | $3,020 | $23,223 | $14,353 | $8,870 |
Source: Public Records
Map
Nearby Homes
- 90-62 187th St
- 90-44 187th St
- 90-45 186th St
- 188-09 Jamaica Ave
- 90-19 185th St
- 90-31 185th St
- 90-21 185th St
- 188-14 Woodhull Ave
- 8839 186th St
- 191-13 Jamaica Ave
- 88-22 186th St
- 9113 184th St
- 8931 184th St
- 184-09 Jamaica Ave
- 187-14 Wexford Terrace
- 8746 Chelsea St Unit 6E
- 8746 Chelsea St Unit 7H
- 8829 184th St
- 185-05 Henderson Ave
- 184-15 Henderson Ave
- 90-12 188th St
- 9016 188th St
- 9004 188th St
- 9020 188th St
- 9015 187th Place
- 9011 187th Place
- 9009 187th Place
- 9017 187th Place
- 9005 187th Place
- 9025 187th Place
- 9025 187th Place
- 18730 90th Ave
- 9015 188th St
- 9028 188th St
- 90-21 188th St Unit 2
- 90-21 188th St Unit 1+B
- 90-21 188th St Unit 3
- 9005 188th St
- 9027 187th Place
- 9021 188th St