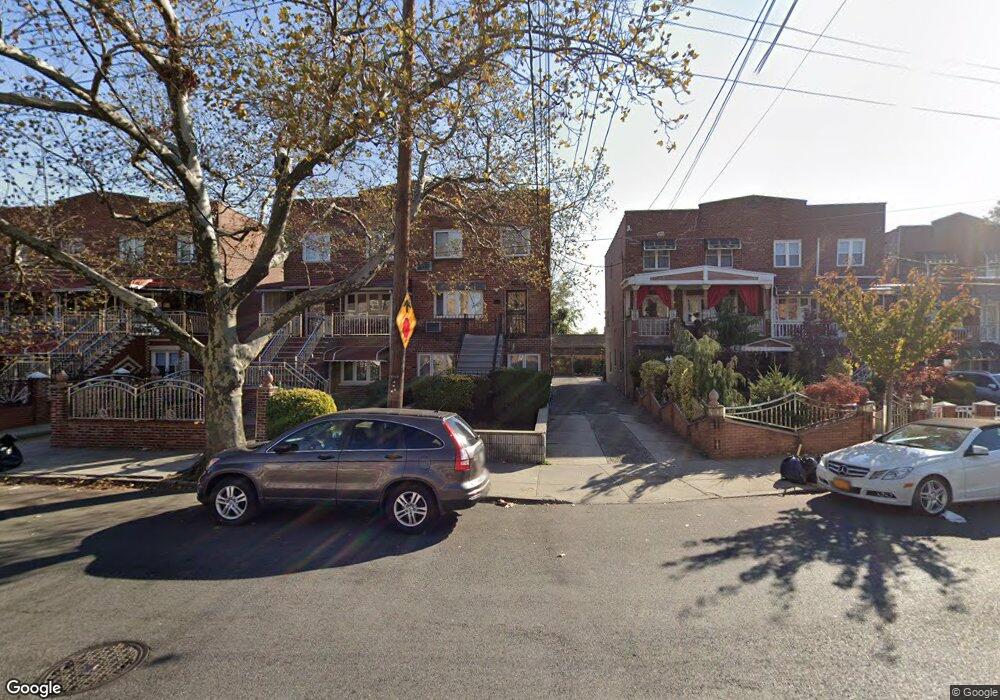
9012 Avenue K Brooklyn, NY 11236
Canarsie NeighborhoodEstimated Value: $901,596 - $1,065,000
--
Bed
--
Bath
2,220
Sq Ft
$449/Sq Ft
Est. Value
About This Home
This home is located at 9012 Avenue K, Brooklyn, NY 11236 and is currently estimated at $995,899, approximately $448 per square foot. 9012 Avenue K is a home located in Kings County with nearby schools including P.S. 115 Daniel Mucatel School, Is 68 Isaac Bildersee, and Explore Excel Charter School.
Ownership History
Date
Name
Owned For
Owner Type
Purchase Details
Closed on
Aug 22, 2008
Sold by
Driscoll Marie and Driscoll William T
Bought by
Lam Chi Fai and Tong Shui Man
Current Estimated Value
Home Financials for this Owner
Home Financials are based on the most recent Mortgage that was taken out on this home.
Original Mortgage
$605,500
Outstanding Balance
$404,364
Interest Rate
6.69%
Mortgage Type
Purchase Money Mortgage
Estimated Equity
$591,535
Purchase Details
Closed on
Oct 31, 2006
Sold by
Reese Angella
Bought by
Carrington Allister
Home Financials for this Owner
Home Financials are based on the most recent Mortgage that was taken out on this home.
Original Mortgage
$487,500
Interest Rate
6.36%
Mortgage Type
Purchase Money Mortgage
Purchase Details
Closed on
Oct 24, 2005
Sold by
Alexis Jennifer and Alexis Elicier
Bought by
Reese Angella
Home Financials for this Owner
Home Financials are based on the most recent Mortgage that was taken out on this home.
Original Mortgage
$484,725
Interest Rate
5.85%
Mortgage Type
Purchase Money Mortgage
Create a Home Valuation Report for This Property
The Home Valuation Report is an in-depth analysis detailing your home's value as well as a comparison with similar homes in the area
Home Values in the Area
Average Home Value in this Area
Purchase History
| Date | Buyer | Sale Price | Title Company |
|---|---|---|---|
| Lam Chi Fai | $865,000 | -- | |
| Lam Chi Fai | $865,000 | -- | |
| Carrington Allister | $650,000 | -- | |
| Carrington Allister | $650,000 | -- | |
| Reese Angella | $650,000 | -- | |
| Reese Angella | $650,000 | -- |
Source: Public Records
Mortgage History
| Date | Status | Borrower | Loan Amount |
|---|---|---|---|
| Open | Lam Chi Fai | $605,500 | |
| Closed | Lam Chi Fai | $605,500 | |
| Previous Owner | Carrington Allister | $487,500 | |
| Previous Owner | Reese Angella | $161,575 | |
| Previous Owner | Reese Angella | $484,725 | |
| Closed | Carrington Allister | $162,500 |
Source: Public Records
Tax History Compared to Growth
Tax History
| Year | Tax Paid | Tax Assessment Tax Assessment Total Assessment is a certain percentage of the fair market value that is determined by local assessors to be the total taxable value of land and additions on the property. | Land | Improvement |
|---|---|---|---|---|
| 2025 | $9,338 | $70,440 | $12,240 | $58,200 |
| 2024 | $9,338 | $69,180 | $12,240 | $56,940 |
| 2023 | $8,893 | $79,680 | $12,240 | $67,440 |
| 2022 | $8,230 | $67,740 | $12,240 | $55,500 |
| 2021 | $8,174 | $56,520 | $12,240 | $44,280 |
| 2020 | $4,063 | $47,220 | $12,240 | $34,980 |
| 2019 | $8,056 | $43,500 | $12,240 | $31,260 |
| 2018 | $7,379 | $37,656 | $11,431 | $26,225 |
| 2017 | $6,948 | $35,552 | $9,908 | $25,644 |
| 2016 | $6,395 | $33,540 | $12,240 | $21,300 |
| 2015 | $3,895 | $34,080 | $13,620 | $20,460 |
| 2014 | $3,895 | $33,260 | $13,292 | $19,968 |
Source: Public Records
Map
Nearby Homes
- 1126 E 89th St
- 1361 E 91st St Unit 503B
- 1366 E 92nd St Unit 201
- 1160 E 89th St
- 9021 Avenue L
- 1015 E 88th St
- 1378 E 93rd St
- 8916 Avenue L
- 8906 Avenue L
- 1265 E 92nd St
- 9303 Avenue K
- 9024 Avenue L
- 1243 E 91st St
- 1021 E 87th St Unit 6B
- 1409 E 92nd St
- 1440 E 91st St Unit 2
- 9215 Avenue L
- 1039 E 86th St Unit 1
- 1039 E 86th St
- 9301 Avenue L