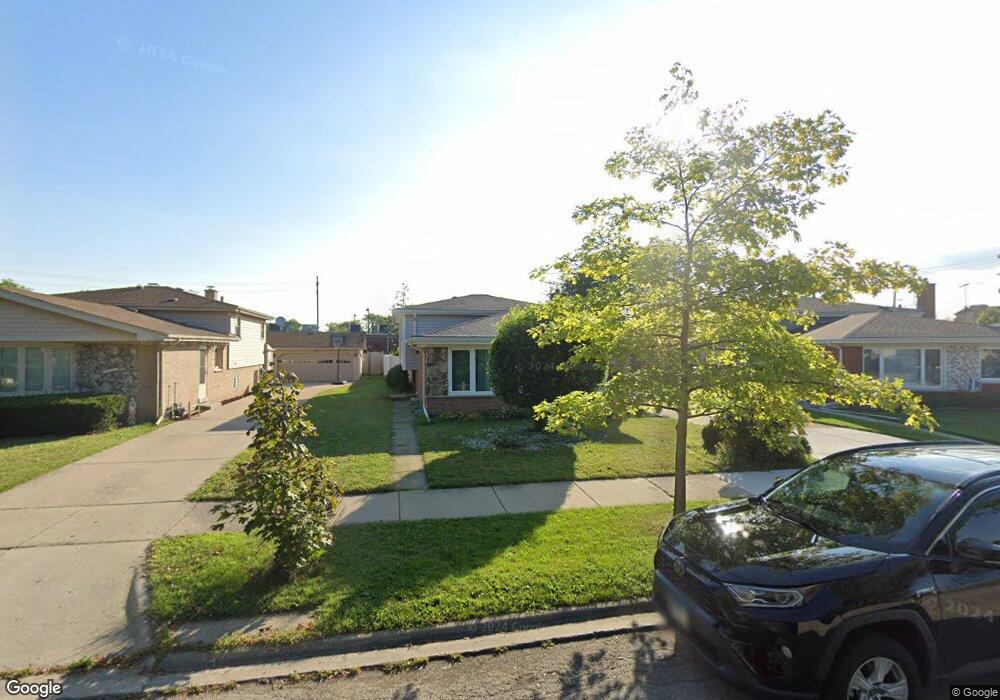
9013 N Joey Dr Niles, IL 60714
Ballard Terrace NeighborhoodEstimated Value: $446,462 - $488,000
3
Beds
2
Baths
1,189
Sq Ft
$396/Sq Ft
Est. Value
About This Home
This home is located at 9013 N Joey Dr, Niles, IL 60714 and is currently estimated at $470,616, approximately $395 per square foot. 9013 N Joey Dr is a home located in Cook County with nearby schools including V H Nelson Elementary School, Gemini Middle School, and Maine East High School.
Ownership History
Date
Name
Owned For
Owner Type
Purchase Details
Closed on
Mar 9, 2017
Sold by
Montes Rita C
Bought by
Biascan Clarisse Joy and Devera Martinez Heidi
Current Estimated Value
Home Financials for this Owner
Home Financials are based on the most recent Mortgage that was taken out on this home.
Original Mortgage
$304,323
Outstanding Balance
$253,751
Interest Rate
4.37%
Mortgage Type
FHA
Estimated Equity
$216,865
Purchase Details
Closed on
Jan 4, 1994
Sold by
Apostolopoulos Vasiliki
Bought by
Montes Rita C
Home Financials for this Owner
Home Financials are based on the most recent Mortgage that was taken out on this home.
Original Mortgage
$117,000
Interest Rate
7.29%
Purchase Details
Closed on
Dec 2, 1993
Sold by
Apostolopoulos Fotios
Bought by
Apostolopoulos Vasiliki
Home Financials for this Owner
Home Financials are based on the most recent Mortgage that was taken out on this home.
Original Mortgage
$117,000
Interest Rate
7.29%
Create a Home Valuation Report for This Property
The Home Valuation Report is an in-depth analysis detailing your home's value as well as a comparison with similar homes in the area
Home Values in the Area
Average Home Value in this Area
Purchase History
| Date | Buyer | Sale Price | Title Company |
|---|---|---|---|
| Biascan Clarisse Joy | $310,000 | Heritage Title Company | |
| Montes Rita C | $134,666 | -- | |
| Apostolopoulos Vasiliki | -- | -- |
Source: Public Records
Mortgage History
| Date | Status | Borrower | Loan Amount |
|---|---|---|---|
| Open | Biascan Clarisse Joy | $304,323 | |
| Previous Owner | Montes Rita C | $117,000 |
Source: Public Records
Tax History Compared to Growth
Tax History
| Year | Tax Paid | Tax Assessment Tax Assessment Total Assessment is a certain percentage of the fair market value that is determined by local assessors to be the total taxable value of land and additions on the property. | Land | Improvement |
|---|---|---|---|---|
| 2024 | $7,648 | $33,000 | $6,663 | $26,337 |
| 2023 | $7,158 | $33,000 | $6,663 | $26,337 |
| 2022 | $7,158 | $33,000 | $6,663 | $26,337 |
| 2021 | $6,459 | $25,588 | $5,711 | $19,877 |
| 2020 | $6,170 | $25,588 | $5,711 | $19,877 |
| 2019 | $7,804 | $32,390 | $5,711 | $26,679 |
| 2018 | $7,411 | $27,789 | $4,918 | $22,871 |
| 2017 | $6,447 | $27,789 | $4,918 | $22,871 |
| 2016 | $6,232 | $27,789 | $4,918 | $22,871 |
| 2015 | $5,842 | $24,343 | $4,124 | $20,219 |
| 2014 | $5,651 | $24,343 | $4,124 | $20,219 |
| 2013 | $5,534 | $24,343 | $4,124 | $20,219 |
Source: Public Records
Map
Nearby Homes
- 8802 N Prospect St
- 8803 N Grand St
- 8909 N Washington St Unit E
- 9056 N Clifton Ave
- 8906 N Wisner St
- 9246 N Courtland Dr
- 7901 W Park Ave
- 8819 N Wisner St
- 9270 N Courtland Dr
- 9049 N Greenwood Ave
- 7803 Churchill St
- 9138 Greenwood Ave
- 8426 W Betty Terrace
- 7730 Dempster St Unit 304
- 8100 W Foster Ln Unit C410
- 7948 Beckwith Rd
- 9216 Ozark St
- 7701 Lake St
- 8000 W Foster Ln Unit B208
- 7710 W Dempster St Unit 304
- 9017 N Joey Dr
- 9009 N Joey Dr
- 9005 N Joey Dr
- 9021 N Joey Dr
- 9026 N Milwaukee Ave
- 9030 N Joey Dr
- 8200 W Ballard Rd
- 9030 N Milwaukee Ave
- 9001 N Joey Dr
- 9022 N Milwaukee Ave
- 9025 N Joey Dr
- 8220 W Ballard Rd
- 8150 W Ballard Rd
- 9034 N Joey Dr
- 8224 W Ballard Rd
- 9029 N Joey Dr
- 8228 W Ballard Rd
- 9038 N Joey Dr
- 9002 N Milwaukee Ave
- 8232 W Ballard Rd