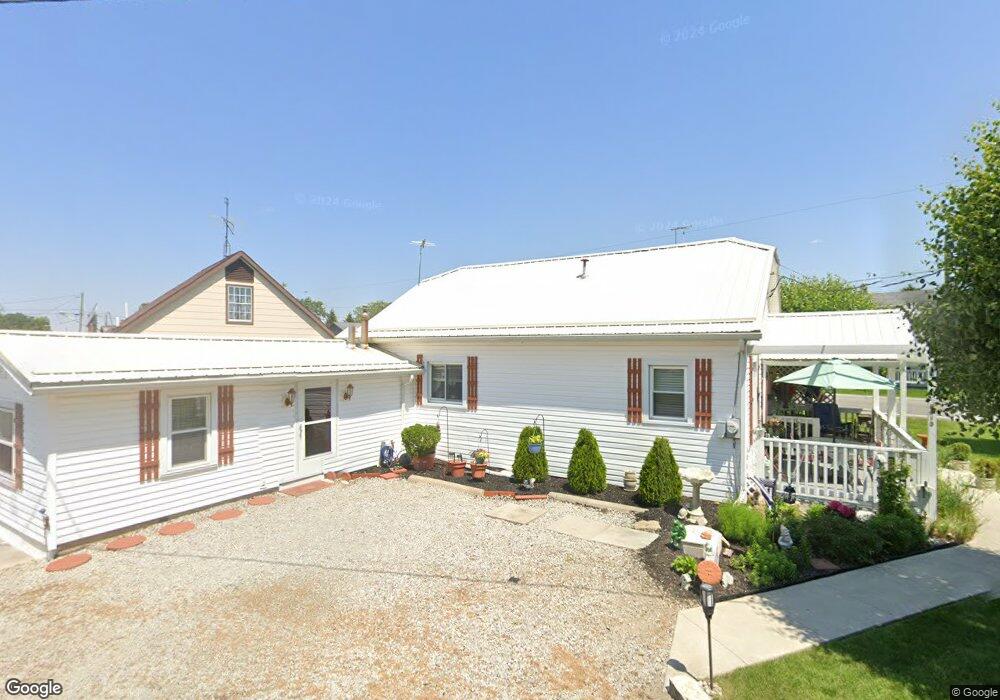
9013 Painter Creek Arcanum Rd Arcanum, OH 45304
Estimated Value: $80,444 - $129,000
2
Beds
1
Bath
1,026
Sq Ft
$106/Sq Ft
Est. Value
About This Home
This home is located at 9013 Painter Creek Arcanum Rd, Arcanum, OH 45304 and is currently estimated at $108,361, approximately $105 per square foot. 9013 Painter Creek Arcanum Rd is a home with nearby schools including Franklin Monroe Elementary School and Franklin Monroe High School.
Ownership History
Date
Name
Owned For
Owner Type
Purchase Details
Closed on
Aug 24, 2020
Sold by
Estate Of George W Skelton
Bought by
Skelton Barbara J
Current Estimated Value
Purchase Details
Closed on
Aug 14, 2001
Sold by
Bank One
Bought by
Skelton George W and Skelton Barbara
Home Financials for this Owner
Home Financials are based on the most recent Mortgage that was taken out on this home.
Original Mortgage
$16,465
Outstanding Balance
$6,423
Interest Rate
7.15%
Mortgage Type
New Conventional
Estimated Equity
$101,938
Purchase Details
Closed on
Apr 12, 2001
Sold by
Mcdowell Philip
Bought by
Bank One
Purchase Details
Closed on
Jun 17, 1994
Sold by
Patterson William B
Bought by
Mcdowell Philip W and Mcdowell Nicole A
Home Financials for this Owner
Home Financials are based on the most recent Mortgage that was taken out on this home.
Original Mortgage
$38,500
Interest Rate
8.58%
Mortgage Type
New Conventional
Create a Home Valuation Report for This Property
The Home Valuation Report is an in-depth analysis detailing your home's value as well as a comparison with similar homes in the area
Home Values in the Area
Average Home Value in this Area
Purchase History
| Date | Buyer | Sale Price | Title Company |
|---|---|---|---|
| Skelton Barbara J | -- | None Available | |
| Skelton George W | $18,500 | -- | |
| Bank One | $20,000 | -- | |
| Mcdowell Philip W | $38,500 | -- |
Source: Public Records
Mortgage History
| Date | Status | Borrower | Loan Amount |
|---|---|---|---|
| Open | Skelton George W | $16,465 | |
| Previous Owner | Mcdowell Philip W | $38,500 |
Source: Public Records
Tax History Compared to Growth
Tax History
| Year | Tax Paid | Tax Assessment Tax Assessment Total Assessment is a certain percentage of the fair market value that is determined by local assessors to be the total taxable value of land and additions on the property. | Land | Improvement |
|---|---|---|---|---|
| 2024 | $359 | $20,530 | $3,030 | $17,500 |
| 2023 | $381 | $20,530 | $3,030 | $17,500 |
| 2022 | $302 | $16,620 | $2,520 | $14,100 |
| 2021 | $305 | $16,620 | $2,520 | $14,100 |
| 2020 | $292 | $16,620 | $2,520 | $14,100 |
| 2019 | $217 | $14,780 | $2,520 | $12,260 |
| 2018 | $219 | $14,780 | $2,520 | $12,260 |
| 2017 | $198 | $14,780 | $2,520 | $12,260 |
| 2016 | $200 | $14,700 | $4,040 | $10,660 |
| 2015 | $200 | $14,700 | $4,040 | $10,660 |
| 2014 | $201 | $14,700 | $4,040 | $10,660 |
| 2013 | $181 | $13,730 | $4,040 | $9,690 |
Source: Public Records
Map
Nearby Homes
- 0 N Furlong Rd
- 0 Delisle Fourman Rd
- 200 N Jefferson St
- 220 Baker St
- 508 S Jefferson St
- 2255 Red River-West Grove Rd
- 2255 Red River West Grove Rd
- 2288 N State Route 721
- 2546 Gordon Landis Rd
- 9980 Ohio 718
- 111 E Pike St
- 13 Laura Cir
- 11299 Coppock Rd
- 11863 Hall Rd
- Alt St Rt 49 Alt State Route 49
- 2 Edgewood Dr
- 3794 State Route 49
- 3 Greenmoor Dr
- 8784 Grubbs Rex Rd
- 8746 Grubbs Rex Rd
- 9009 State Route 571
- 9007 State Route 571
- 9014 State Route 571
- 9010 State Route 571
- 9005 State Route 571
- 9006 State Route 571
- 3995 Schnorf Jones Rd
- 9002 State Route 571
- 9002 Ohio 571
- 9022 Painter Creek Arcanum Rd
- 9019 State Route 571
- 9002 State Route 571
- 9002 State Route 571 Unit Arcanum
- 9002 State Route 571 Unit 9004
- 3979 Schnorf Jones Rd
- 9030 Painter Creek Arcanum Rd
- 3971 Schnorf-Jones Rd
- 8994 State Route 571
- 3971 Schnorf Jones Rd
- 9038 State Route 571