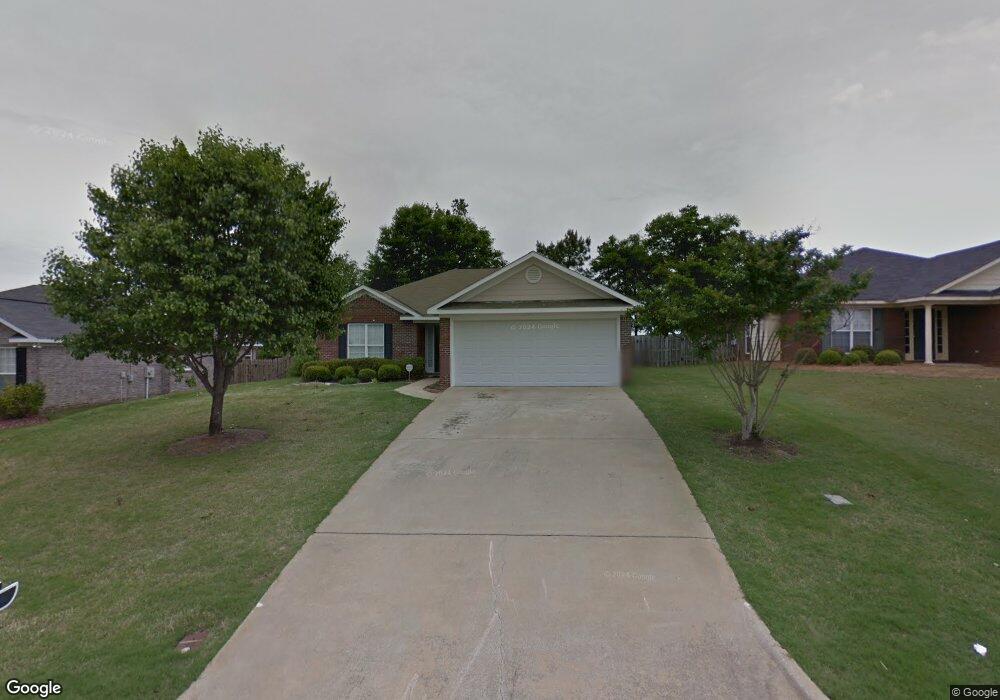
9013 Seedling Dr Midland, GA 31820
Midland NeighborhoodEstimated Value: $253,000 - $259,000
3
Beds
3
Baths
1,443
Sq Ft
$178/Sq Ft
Est. Value
About This Home
This home is located at 9013 Seedling Dr, Midland, GA 31820 and is currently estimated at $256,551, approximately $177 per square foot. 9013 Seedling Dr is a home located in Muscogee County with nearby schools including Mathews Elementary School, Aaron Cohn Middle School, and Shaw High School.
Ownership History
Date
Name
Owned For
Owner Type
Purchase Details
Closed on
Jan 23, 2020
Sold by
Perez Mary Ann
Bought by
Perez Rafael I
Current Estimated Value
Home Financials for this Owner
Home Financials are based on the most recent Mortgage that was taken out on this home.
Original Mortgage
$137,627
Outstanding Balance
$121,926
Interest Rate
3.74%
Mortgage Type
VA
Estimated Equity
$134,625
Purchase Details
Closed on
Jul 25, 2014
Sold by
Pestrak Mary A
Bought by
Perez I Rafael and Perez Mary Ann
Home Financials for this Owner
Home Financials are based on the most recent Mortgage that was taken out on this home.
Original Mortgage
$148,000
Interest Rate
4.19%
Mortgage Type
VA
Purchase Details
Closed on
Aug 27, 2009
Sold by
Craighton Rachel W and Willis Rachel
Bought by
Pestrak Mary A
Home Financials for this Owner
Home Financials are based on the most recent Mortgage that was taken out on this home.
Original Mortgage
$128,000
Interest Rate
5.19%
Mortgage Type
New Conventional
Create a Home Valuation Report for This Property
The Home Valuation Report is an in-depth analysis detailing your home's value as well as a comparison with similar homes in the area
Home Values in the Area
Average Home Value in this Area
Purchase History
| Date | Buyer | Sale Price | Title Company |
|---|---|---|---|
| Perez Rafael I | -- | -- | |
| Perez I Rafael | $148,000 | -- | |
| Pestrak Mary A | $160,000 | None Available |
Source: Public Records
Mortgage History
| Date | Status | Borrower | Loan Amount |
|---|---|---|---|
| Open | Perez Rafael I | $137,627 | |
| Previous Owner | Perez I Rafael | $148,000 | |
| Previous Owner | Pestrak Mary A | $128,000 |
Source: Public Records
Tax History Compared to Growth
Tax History
| Year | Tax Paid | Tax Assessment Tax Assessment Total Assessment is a certain percentage of the fair market value that is determined by local assessors to be the total taxable value of land and additions on the property. | Land | Improvement |
|---|---|---|---|---|
| 2025 | -- | $96,220 | $21,944 | $74,276 |
| 2024 | -- | $96,220 | $21,944 | $74,276 |
| 2023 | $0 | $96,220 | $21,944 | $74,276 |
| 2022 | $975 | $71,784 | $15,944 | $55,840 |
| 2021 | $1,597 | $59,136 | $15,944 | $43,192 |
| 2020 | $1,598 | $59,136 | $15,944 | $43,192 |
| 2019 | $1,605 | $59,136 | $15,944 | $43,192 |
| 2018 | $1,605 | $59,136 | $15,944 | $43,192 |
| 2017 | $1,613 | $59,136 | $15,944 | $43,192 |
| 2016 | $1,621 | $59,200 | $12,600 | $46,600 |
| 2015 | $1,624 | $59,200 | $12,600 | $46,600 |
| 2014 | $905 | $63,952 | $12,600 | $51,352 |
| 2013 | -- | $63,952 | $12,600 | $51,352 |
Source: Public Records
Map
Nearby Homes
- 7337 Pine Tar Dr
- 7365 Pine Tar Dr
- 7156 Tall Pine Ct
- 7133 Tall Pine Ct
- 7300 Pine Chase Dr
- 9620 Hollow Pine Dr
- 9759 Pine Seed Ct
- 7988 Westlake Dr
- 7312 Pine Chase Dr
- 7107 Pine Seed Dr
- 7390 Pine Tar Dr
- 7382 Pine Tar Dr
- 8973 Orchard Valley Ln
- 8013 Barton Dr
- 7346 Pine Chase Dr
- 7343 Pine Chase Dr
- 7359 Pine Tar Dr
- 7381 Pine Tar Dr
- 7333 Pine Chase Dr
- 8016 Glen Valley Dr
- 9015 Seedling Dr
- 9011 Seedling Dr
- 8024 Garrett Pines Dr
- 9019 Seedling Dr
- 8026 Garrett Pines Dr
- 8022 Garrett Pines Dr
- 8028 Garrett Pines Dr
- 9012 Seedling Dr
- 9023 Seedling Dr
- 9014 Seedling Dr
- 9010 Seedling Dr
- 8030 Garrett Pines Dr
- 9009 Seedling Dr
- 9018 Seedling Dr
- 9027 Seedling Dr
- 8020 Garrett Pines Dr
- 8025 Garrett Pines Dr
- 9022 Seedling Dr
- 8027 Garrett Pines Dr
- 8032 Garrett Pines Dr