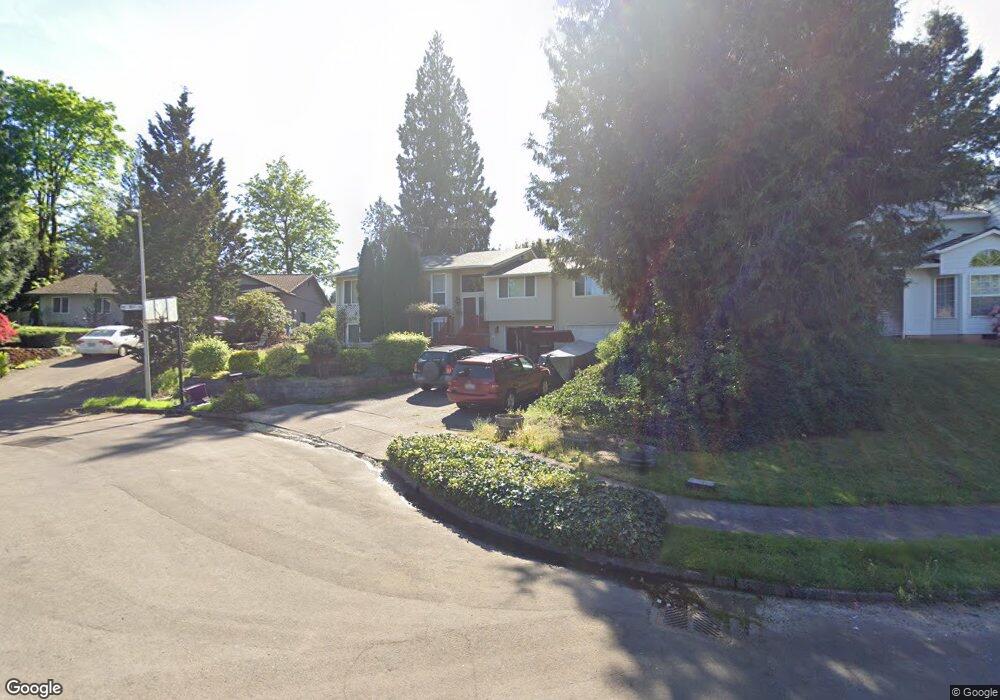
9015 NE 79th Ct Vancouver, WA 98662
Estimated Value: $501,074 - $519,000
3
Beds
2
Baths
1,552
Sq Ft
$329/Sq Ft
Est. Value
About This Home
This home is located at 9015 NE 79th Ct, Vancouver, WA 98662 and is currently estimated at $510,019, approximately $328 per square foot. 9015 NE 79th Ct is a home located in Clark County with nearby schools including Glenwood Heights Primary School, Laurin Middle School, and Prairie High School.
Ownership History
Date
Name
Owned For
Owner Type
Purchase Details
Closed on
Apr 12, 2002
Sold by
Kanooth Kenneth A
Bought by
Vanbrunt Clifford O and Vanbrunt Robin G
Current Estimated Value
Home Financials for this Owner
Home Financials are based on the most recent Mortgage that was taken out on this home.
Original Mortgage
$149,600
Outstanding Balance
$61,883
Interest Rate
6.78%
Estimated Equity
$448,136
Purchase Details
Closed on
Sep 16, 1999
Sold by
Oliver Kay F and Dyer Kenneth E
Bought by
Kanooth Kenneth A
Home Financials for this Owner
Home Financials are based on the most recent Mortgage that was taken out on this home.
Original Mortgage
$120,200
Interest Rate
7.5%
Purchase Details
Closed on
Sep 9, 1996
Sold by
Graaf Charles E and Graaf Anita
Bought by
Oliver Kay F and Dyer Kenneth E
Home Financials for this Owner
Home Financials are based on the most recent Mortgage that was taken out on this home.
Original Mortgage
$108,000
Interest Rate
7.87%
Create a Home Valuation Report for This Property
The Home Valuation Report is an in-depth analysis detailing your home's value as well as a comparison with similar homes in the area
Home Values in the Area
Average Home Value in this Area
Purchase History
| Date | Buyer | Sale Price | Title Company |
|---|---|---|---|
| Vanbrunt Clifford O | $170,000 | First American Title Ins Co | |
| Kanooth Kenneth A | $150,300 | Chicago Title Insurance Co | |
| Oliver Kay F | -- | Chicago Title Insurance Co |
Source: Public Records
Mortgage History
| Date | Status | Borrower | Loan Amount |
|---|---|---|---|
| Open | Vanbrunt Clifford O | $149,600 | |
| Previous Owner | Kanooth Kenneth A | $120,200 | |
| Previous Owner | Oliver Kay F | $108,000 |
Source: Public Records
Tax History Compared to Growth
Tax History
| Year | Tax Paid | Tax Assessment Tax Assessment Total Assessment is a certain percentage of the fair market value that is determined by local assessors to be the total taxable value of land and additions on the property. | Land | Improvement |
|---|---|---|---|---|
| 2025 | $3,860 | $499,419 | $196,000 | $303,419 |
| 2024 | $3,707 | $449,621 | $196,000 | $253,621 |
| 2023 | $3,567 | $478,987 | $208,000 | $270,987 |
| 2022 | $3,525 | $425,489 | $186,000 | $239,489 |
| 2021 | $3,431 | $381,957 | $138,750 | $243,207 |
| 2020 | $3,385 | $336,867 | $123,000 | $213,867 |
| 2019 | $2,948 | $323,687 | $123,000 | $200,687 |
| 2018 | $3,418 | $320,140 | $0 | $0 |
| 2017 | $2,918 | $282,038 | $0 | $0 |
| 2016 | $2,812 | $257,465 | $0 | $0 |
| 2015 | $2,766 | $228,048 | $0 | $0 |
| 2014 | -- | $211,921 | $0 | $0 |
| 2013 | -- | $191,150 | $0 | $0 |
Source: Public Records
Map
Nearby Homes
- 8111 NE 88th St
- 7501 NE 87th St
- 9311 NE 72nd Ave
- 8712 NE Centerpointe Dr
- 9610 NE 87th Ave
- 10020 NE 82nd Ave
- 8800 NE 82nd St
- 9006 NE 89th Cir
- 9011 NE 89th Cir
- 9714 NE 91st Ave
- 10400 NE 82nd Ave Unit 18
- 8003 NE 87th Ave
- 7618 NE Meadows Dr
- 9217 NE 81st Loop
- 10909 NE 64th Ct Unit Lot 3
- 11003 NE 64th Ct Unit Lot 7
- 10917 NE 64th Ct
- 11015 NE 64th Ct Unit Lot 10
- 11007 NE 64th Ct Unit Lot 8
- 11101 NE 64th Ct Unit Lot 14
- 9009 NE 79th Ct
- 9103 NE 79th Ct
- 8101 NE 91st St
- 8105 NE 91st St
- 9005 NE 79th Ct
- 9116 NE 79th Ct
- 9016 NE 79th Ct
- 9102 NE 81st Ave
- 9109 NE 79th Ct
- 9006 NE 79th Ct
- 8919 NE 79th Ct
- 8107 NE 91st St
- 9108 NE 79th Ct
- 9110 NE 81st Ave
- 9115 NE 79th Ct
- 8020 NE 88th St
- 9012 NE 79th Ct
- 8917 NE 79th Ct
- 9200 NE 79th Ct
- 8111 NE 91st St