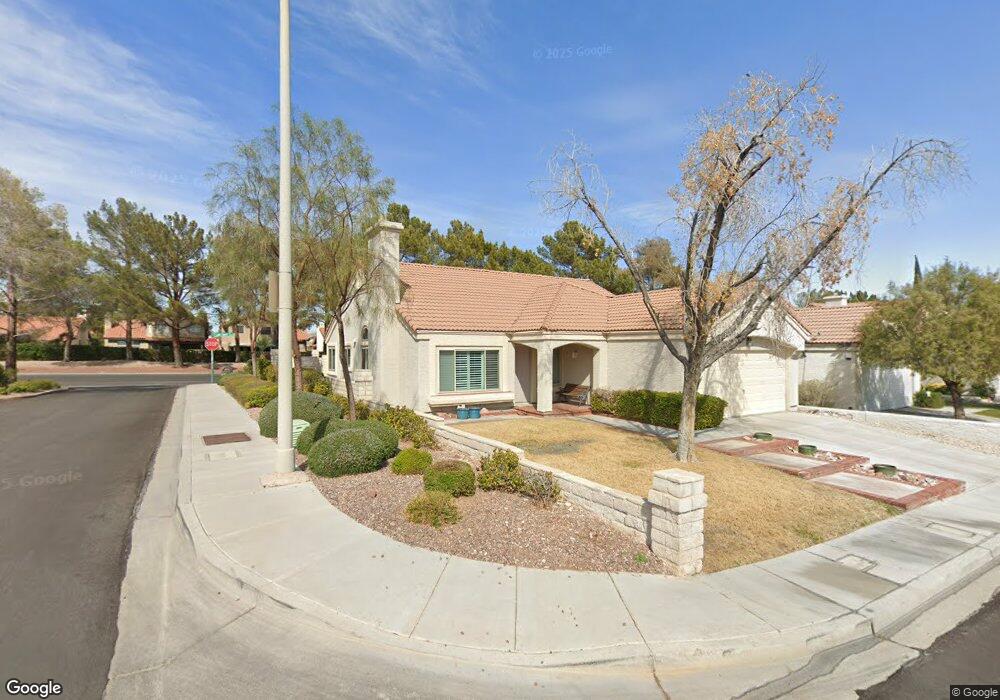
9016 Cypress Point Way Las Vegas, NV 89117
The Lakes NeighborhoodEstimated Value: $427,866 - $485,000
4
Beds
2
Baths
1,528
Sq Ft
$300/Sq Ft
Est. Value
About This Home
This home is located at 9016 Cypress Point Way, Las Vegas, NV 89117 and is currently estimated at $458,967, approximately $300 per square foot. 9016 Cypress Point Way is a home located in Clark County with nearby schools including M J Christensen Elementary School, Clifford J Lawrence Junior High School, and Spring Valley High School.
Ownership History
Date
Name
Owned For
Owner Type
Purchase Details
Closed on
Jul 7, 2000
Sold by
Morris Gwen D and Paciorek Meddy A
Bought by
Paciorek Gwen D and Paciorek Meddy A
Current Estimated Value
Purchase Details
Closed on
Mar 25, 1998
Sold by
Morris Peter Wester
Bought by
Morris Gwen D
Home Financials for this Owner
Home Financials are based on the most recent Mortgage that was taken out on this home.
Original Mortgage
$116,565
Outstanding Balance
$21,400
Interest Rate
7.06%
Mortgage Type
FHA
Estimated Equity
$437,567
Purchase Details
Closed on
Feb 16, 1998
Sold by
Mannino Margaret and Crawford Carole
Bought by
Morris Gwen D and Paciorek Meddy A
Home Financials for this Owner
Home Financials are based on the most recent Mortgage that was taken out on this home.
Original Mortgage
$116,565
Outstanding Balance
$21,400
Interest Rate
7.06%
Mortgage Type
FHA
Estimated Equity
$437,567
Create a Home Valuation Report for This Property
The Home Valuation Report is an in-depth analysis detailing your home's value as well as a comparison with similar homes in the area
Home Values in the Area
Average Home Value in this Area
Purchase History
| Date | Buyer | Sale Price | Title Company |
|---|---|---|---|
| Paciorek Gwen D | -- | -- | |
| Morris Gwen D | -- | Old Republic Title Company | |
| Paciorek Meddy A | -- | Old Republic Title Company | |
| Morris Gwen D | $120,000 | Old Republic Title Company |
Source: Public Records
Mortgage History
| Date | Status | Borrower | Loan Amount |
|---|---|---|---|
| Open | Paciorek Meddy A | $116,565 |
Source: Public Records
Tax History Compared to Growth
Tax History
| Year | Tax Paid | Tax Assessment Tax Assessment Total Assessment is a certain percentage of the fair market value that is determined by local assessors to be the total taxable value of land and additions on the property. | Land | Improvement |
|---|---|---|---|---|
| 2025 | $1,716 | $76,995 | $35,000 | $41,995 |
| 2024 | $1,667 | $76,995 | $35,000 | $41,995 |
| 2023 | $1,667 | $72,030 | $31,500 | $40,530 |
| 2022 | $1,619 | $65,798 | $28,350 | $37,448 |
| 2021 | $1,571 | $59,399 | $23,450 | $35,949 |
| 2020 | $1,523 | $61,208 | $25,200 | $36,008 |
| 2019 | $1,478 | $57,158 | $21,350 | $35,808 |
| 2018 | $1,435 | $53,953 | $19,250 | $34,703 |
| 2017 | $1,734 | $52,868 | $17,500 | $35,368 |
| 2016 | $1,360 | $48,516 | $12,600 | $35,916 |
| 2015 | $1,356 | $40,132 | $10,150 | $29,982 |
| 2014 | $1,317 | $42,986 | $8,750 | $34,236 |
Source: Public Records
Map
Nearby Homes
- 9028 Cypress Point Way
- 9013 Cypress Point Way
- 9105 Cypress Point Way
- 3205 Bermuda Bay St
- 3120 Waterview Dr
- 3220 Ventana Hills Dr
- 3236 Shoreheight St
- 9305 Alameda Harbor Ave
- 9312 Angelfish Dr
- 3204 Malibu Vista St
- 3332 Ventana Hills Dr
- 3320 S Fort Apache Rd Unit 101
- 9333 Dry Dock Dr
- 8924 Sail Bay Dr
- 9325 W Desert Inn Rd Unit 177
- 9325 W Desert Inn Rd Unit 124
- 9325 W Desert Inn Rd Unit 119
- 9325 W Desert Inn Rd Unit 109
- 9325 W Desert Inn Rd Unit 141
- 9325 W Desert Inn Rd Unit 127
- 9012 Cypress Point Way
- 9008 Cypress Point Way
- 9004 Cypress Point Way
- 9017 Cypress Point Way
- 9021 Cypress Point Way
- 9009 Cypress Point Way
- 9025 Cypress Point Way
- 9025 Cypress Point Rd
- 9000 Cypress Point Way
- 9005 Cypress Point Way
- 9029 Cypress Point Way
- 9036 Cypress Point Way
- 9009 Crystal Glass Dr
- 9033 Cypress Point Way
- 9005 Crystal Glass Dr
- 9013 Crystal Glass Dr
- 9001 Crystal Glass Dr Unit 7A
- 9001 Crystal Glass Dr Unit HOUSE
- 3200 Crystal Pool Dr