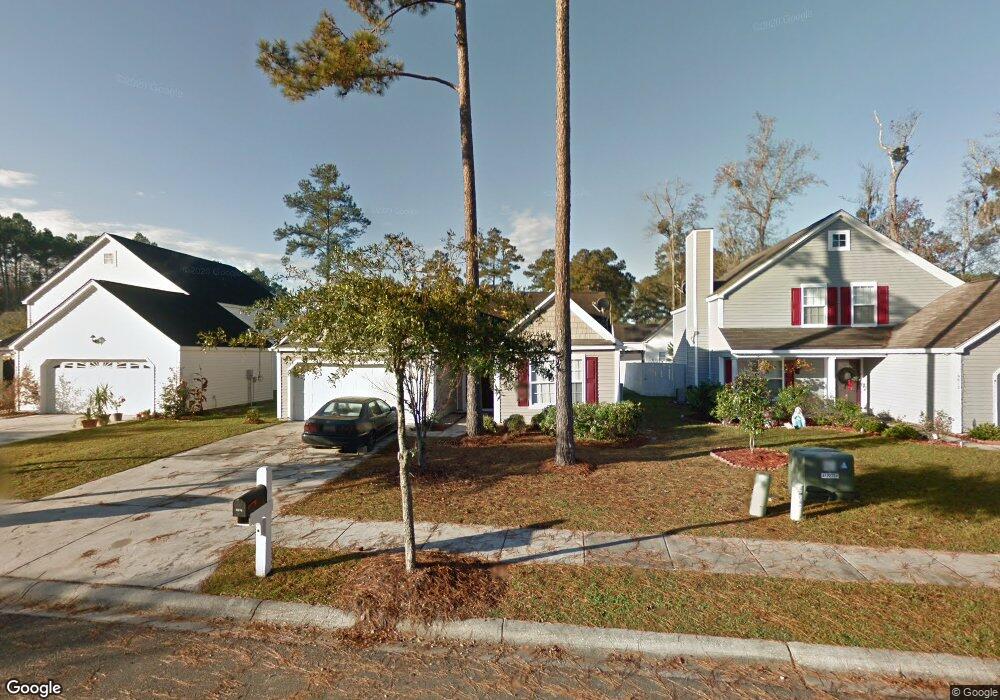
9016 Robins Nest Way Summerville, SC 29485
Estimated Value: $296,248 - $344,000
3
Beds
2
Baths
1,250
Sq Ft
$255/Sq Ft
Est. Value
About This Home
This home is located at 9016 Robins Nest Way, Summerville, SC 29485 and is currently estimated at $319,312, approximately $255 per square foot. 9016 Robins Nest Way is a home located in Dorchester County with nearby schools including Joseph R. Pye Elementary, River Oaks Middle School, and Fort Dorchester High School.
Ownership History
Date
Name
Owned For
Owner Type
Purchase Details
Closed on
Feb 20, 2012
Sold by
Federal Home Loan Mortgage Corporation
Bought by
Cliborne Samantha L
Current Estimated Value
Home Financials for this Owner
Home Financials are based on the most recent Mortgage that was taken out on this home.
Original Mortgage
$122,000
Outstanding Balance
$83,583
Interest Rate
3.89%
Mortgage Type
VA
Estimated Equity
$235,729
Purchase Details
Closed on
Sep 19, 2011
Sold by
Aschenneller Rose Ann
Bought by
Federal Home Loan Mortgage Corporation
Purchase Details
Closed on
Aug 16, 2005
Sold by
D R Horton Inc
Bought by
Aschenneller Rose Ann
Home Financials for this Owner
Home Financials are based on the most recent Mortgage that was taken out on this home.
Original Mortgage
$112,000
Interest Rate
5.57%
Mortgage Type
Future Advance Clause Open End Mortgage
Create a Home Valuation Report for This Property
The Home Valuation Report is an in-depth analysis detailing your home's value as well as a comparison with similar homes in the area
Home Values in the Area
Average Home Value in this Area
Purchase History
| Date | Buyer | Sale Price | Title Company |
|---|---|---|---|
| Cliborne Samantha L | $122,000 | -- | |
| Federal Home Loan Mortgage Corporation | $2,500 | -- | |
| Aschenneller Rose Ann | $166,959 | -- |
Source: Public Records
Mortgage History
| Date | Status | Borrower | Loan Amount |
|---|---|---|---|
| Open | Cliborne Samantha L | $122,000 | |
| Previous Owner | Aschenneller Rose Ann | $112,000 |
Source: Public Records
Tax History Compared to Growth
Tax History
| Year | Tax Paid | Tax Assessment Tax Assessment Total Assessment is a certain percentage of the fair market value that is determined by local assessors to be the total taxable value of land and additions on the property. | Land | Improvement |
|---|---|---|---|---|
| 2024 | $4,905 | $17,524 | $5,700 | $11,824 |
| 2023 | $4,905 | $7,398 | $2,000 | $5,398 |
| 2022 | $1,717 | $6,450 | $2,650 | $3,800 |
| 2021 | $1,717 | $6,450 | $2,650 | $3,800 |
| 2020 | $1,649 | $5,610 | $2,300 | $3,310 |
| 2019 | $1,626 | $5,610 | $2,300 | $3,310 |
| 2018 | $1,446 | $5,610 | $2,300 | $3,310 |
| 2017 | $1,392 | $5,610 | $2,300 | $3,310 |
| 2016 | $1,392 | $5,610 | $2,300 | $3,310 |
| 2015 | $1,389 | $5,610 | $2,300 | $3,310 |
| 2014 | $1,201 | $121,900 | $0 | $0 |
| 2013 | -- | $4,880 | $0 | $0 |
Source: Public Records
Map
Nearby Homes
- 9033 Robins Nest Way
- 4840 Oak Leaf Rd
- 9049 Pickett Fence Ln
- 9032 Pickett Fence Ln
- 9041 Fieldstone Trace
- 9767 Black Willow Ln
- 4860 Hearthside Dr
- 9176 Maple Grove Dr
- 2000 Buttercup Way
- 1000 Buttercup Way
- 4209 Wildwood Landing
- 4824 Willow Brook Ln
- 9126 Maple Grove Dr
- 5200 Preserve Blvd
- 9122 Maple Grove Dr
- 9915 Honeylocust Ln
- 4846 Buttercup Way
- 9923 Honeylocust Ln
- 9020 Greenbriar Dr
- 9946 Winged Elm St
- 9020 Robins Nest Way
- 9012 Robins Nest Way
- 9008 Robins Nest Way
- 4896 Oak Leaf Rd
- 4900 Oak Leaf Rd
- 4892 Oak Leaf Rd
- 9004 Robins Nest Way
- 9017 Robins Nest Way
- 4888 Oak Leaf Rd
- 9024 Robins Nest Way
- 9013 Robins Nest Way
- 9025 Robins Nest Way
- 9009 Robins Nest Way
- 4884 Oak Leaf Rd
- 9029 Robins Nest Way
- 9000 Robins Nest Way
- 4805 Morning Dew Ct
- 9028 Robins Nest Way
- 9005 Robins Nest Way
- 4880 Oak Leaf Rd