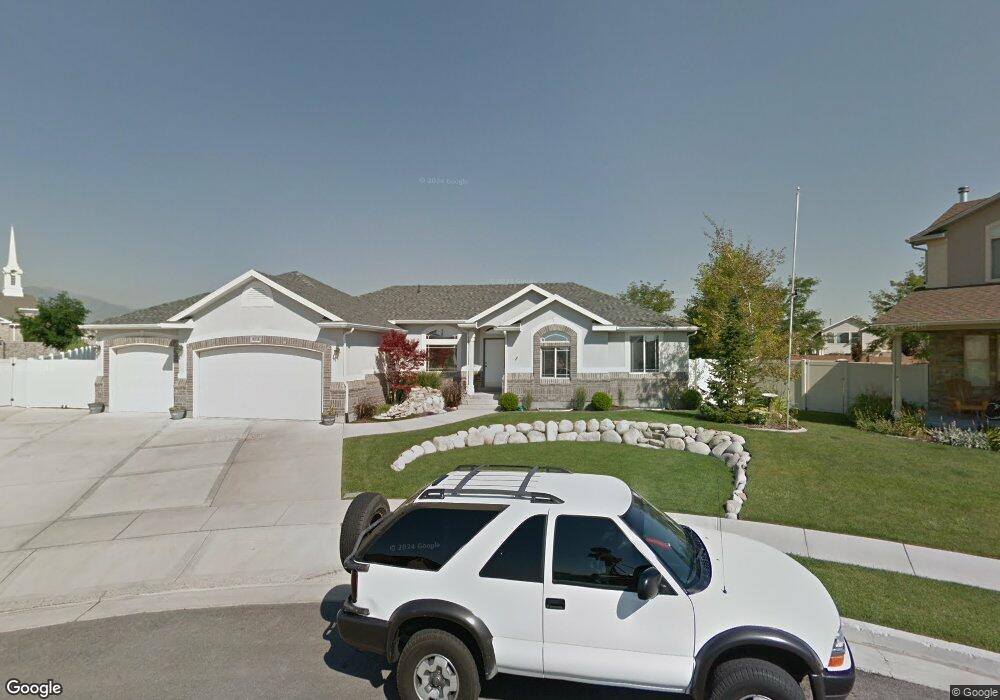
9016 Wisteria Way West Jordan, UT 84081
Copper Hills NeighborhoodEstimated Value: $640,000 - $689,219
3
Beds
2
Baths
1,729
Sq Ft
$388/Sq Ft
Est. Value
About This Home
This home is located at 9016 Wisteria Way, West Jordan, UT 84081 and is currently estimated at $670,305, approximately $387 per square foot. 9016 Wisteria Way is a home located in Salt Lake County with nearby schools including Copper Canyon School, West Hills Middle School, and Copper Hills High School.
Ownership History
Date
Name
Owned For
Owner Type
Purchase Details
Closed on
Jan 13, 2011
Sold by
Nelson Michael and Nelson April N
Bought by
Nelson Michael S and Nelson April N
Current Estimated Value
Home Financials for this Owner
Home Financials are based on the most recent Mortgage that was taken out on this home.
Original Mortgage
$158,000
Outstanding Balance
$4,621
Interest Rate
3.95%
Mortgage Type
New Conventional
Estimated Equity
$665,684
Purchase Details
Closed on
Jun 6, 2003
Sold by
Westview Homes Llc
Bought by
Nelson Michael and Hellstrom April
Home Financials for this Owner
Home Financials are based on the most recent Mortgage that was taken out on this home.
Original Mortgage
$178,400
Interest Rate
5.71%
Mortgage Type
Purchase Money Mortgage
Purchase Details
Closed on
Jan 21, 2003
Sold by
Kfp Corp
Bought by
West View Homes Llc
Create a Home Valuation Report for This Property
The Home Valuation Report is an in-depth analysis detailing your home's value as well as a comparison with similar homes in the area
Home Values in the Area
Average Home Value in this Area
Purchase History
| Date | Buyer | Sale Price | Title Company |
|---|---|---|---|
| Nelson Michael S | -- | Bonneville Superior Title | |
| Nelson Michael | -- | Inwest Title Services | |
| West View Homes Llc | -- | Meridian Title |
Source: Public Records
Mortgage History
| Date | Status | Borrower | Loan Amount |
|---|---|---|---|
| Open | Nelson Michael S | $158,000 | |
| Closed | Nelson Michael | $178,400 |
Source: Public Records
Tax History Compared to Growth
Tax History
| Year | Tax Paid | Tax Assessment Tax Assessment Total Assessment is a certain percentage of the fair market value that is determined by local assessors to be the total taxable value of land and additions on the property. | Land | Improvement |
|---|---|---|---|---|
| 2025 | $3,357 | $668,200 | $174,700 | $493,500 |
| 2024 | $3,357 | $645,900 | $169,800 | $476,100 |
| 2023 | $3,429 | $621,800 | $163,300 | $458,500 |
| 2022 | $3,351 | $597,800 | $160,100 | $437,700 |
| 2021 | $2,841 | $461,400 | $125,000 | $336,400 |
| 2020 | $2,778 | $423,400 | $125,000 | $298,400 |
| 2019 | $2,719 | $406,400 | $125,000 | $281,400 |
| 2018 | $2,572 | $381,300 | $121,500 | $259,800 |
| 2017 | $2,452 | $361,800 | $115,100 | $246,700 |
| 2016 | $2,298 | $318,600 | $115,100 | $203,500 |
| 2015 | $2,215 | $299,400 | $117,300 | $182,100 |
| 2014 | $2,224 | $296,000 | $117,300 | $178,700 |
Source: Public Records
Map
Nearby Homes
- 9118 S Wisteria Way
- 8854 Rocky Creek Dr
- 5098 Cherry Laurel Ln
- 8793 S Big Bar Ct
- 5582 Washoe Cove
- 9332 S Wild Clover Ln
- 4904 Wild Acres Dr
- 8577 Autumn Gold Cir
- 8453 S Windmill Dr
- 4887 W 8620 S
- 8441 S Spratling Dr
- 4707 W Granada Hills Ct
- 4624 Pine Crossing Dr
- 8322 Copper Vista Cir
- 7214 S Sage Run Rd
- 5746 W Swift Creek Rd
- 8501 S Michele River Ave
- 8501 S Michele River Ave Unit 116
- 7903 Mckenzie Ln
- 7886 Mckenzie Ln
- 9034 Wisteria Way
- 9017 Wisteria Way
- 9042 Wisteria Way
- 5313 Mountain Vista Dr
- 5325 W Mountain Vista Dr
- 5325 Mountain Vista Dr
- 5288 Mountain Iris Way
- 5301 Mountain Vista Dr
- 5337 W Mountain Vista Dr
- 5337 Mountain Vista Dr
- 5291 Mountain Vista Dr
- 9052 Wisteria Way
- 5272 Mountain Iris Way
- 9053 Wisteria Way
- 9053 S Wisteria Way
- 5279 W Mountain Vista Dr
- 5279 Mountain Vista Dr
- 8964 S Aspen View Dr
- 5312 Mountain Vista Dr
- 5322 W Soaring Way