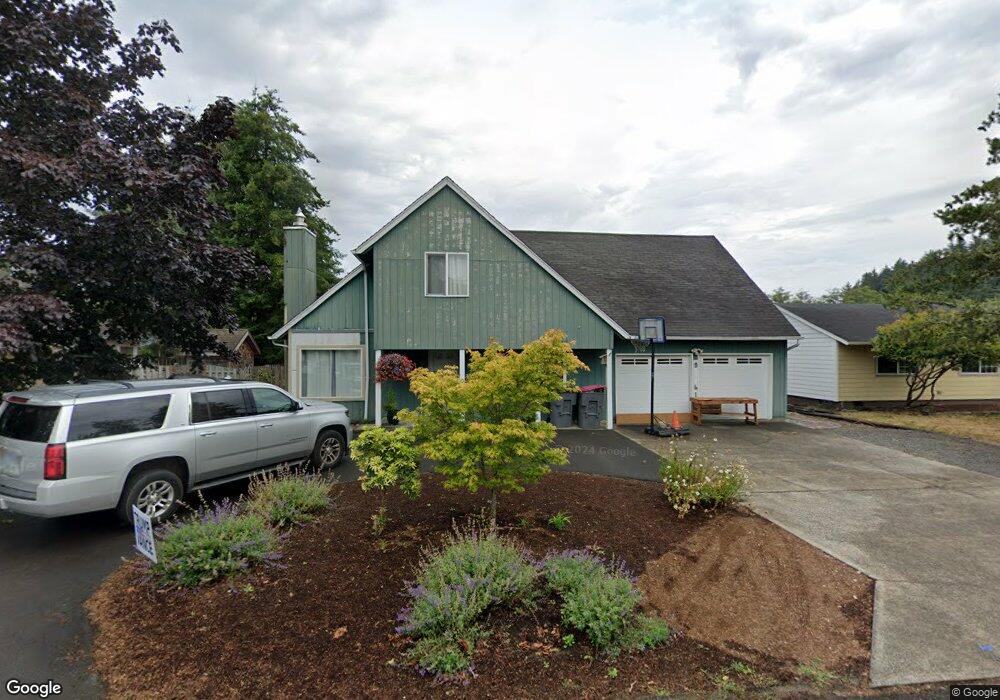
90161 Lake Shore Ct Warrenton, OR 97146
Estimated Value: $448,000 - $597,000
3
Beds
2
Baths
1,542
Sq Ft
$326/Sq Ft
Est. Value
About This Home
This home is located at 90161 Lake Shore Ct, Warrenton, OR 97146 and is currently estimated at $502,761, approximately $326 per square foot. 90161 Lake Shore Ct is a home located in Clatsop County with nearby schools including Seaside High School.
Ownership History
Date
Name
Owned For
Owner Type
Purchase Details
Closed on
Oct 1, 2015
Sold by
The Secretary Of Housing & Urban Develop
Bought by
Huxley Clinton Robert and Huxley Valorie Joy
Current Estimated Value
Home Financials for this Owner
Home Financials are based on the most recent Mortgage that was taken out on this home.
Original Mortgage
$188,522
Outstanding Balance
$147,669
Interest Rate
3.75%
Mortgage Type
FHA
Estimated Equity
$355,092
Purchase Details
Closed on
Apr 3, 2015
Sold by
Lawson Penny S and Columbia Collection Services
Bought by
Guild Mortgage Company
Purchase Details
Closed on
Mar 30, 2015
Sold by
Guild Mortgage Company
Bought by
The Secretary Of Housing & Urban Develop
Purchase Details
Closed on
May 25, 2012
Sold by
Hutson Lois J
Bought by
Lawson Penny S
Home Financials for this Owner
Home Financials are based on the most recent Mortgage that was taken out on this home.
Original Mortgage
$189,287
Interest Rate
4.4%
Mortgage Type
FHA
Create a Home Valuation Report for This Property
The Home Valuation Report is an in-depth analysis detailing your home's value as well as a comparison with similar homes in the area
Home Values in the Area
Average Home Value in this Area
Purchase History
| Date | Buyer | Sale Price | Title Company |
|---|---|---|---|
| Huxley Clinton Robert | $192,000 | Ticor Title Ins Co | |
| Guild Mortgage Company | $218,165 | Pacific Title Company | |
| The Secretary Of Housing & Urban Develop | -- | Pacific Title Company | |
| Lawson Penny S | $192,780 | Ticor Title Ins Co |
Source: Public Records
Mortgage History
| Date | Status | Borrower | Loan Amount |
|---|---|---|---|
| Open | Huxley Clinton Robert | $188,522 | |
| Previous Owner | Lawson Penny S | $189,287 |
Source: Public Records
Tax History Compared to Growth
Tax History
| Year | Tax Paid | Tax Assessment Tax Assessment Total Assessment is a certain percentage of the fair market value that is determined by local assessors to be the total taxable value of land and additions on the property. | Land | Improvement |
|---|---|---|---|---|
| 2024 | $3,434 | $240,001 | -- | -- |
| 2023 | $3,341 | $233,011 | $0 | $0 |
| 2022 | $3,221 | $226,225 | $0 | $0 |
| 2021 | $3,202 | $219,637 | $0 | $0 |
| 2020 | $3,133 | $213,241 | $0 | $0 |
| 2019 | $3,017 | $207,031 | $0 | $0 |
| 2018 | $2,970 | $201,002 | $0 | $0 |
| 2017 | $2,872 | $195,148 | $0 | $0 |
| 2016 | $2,548 | $189,465 | $48,708 | $140,757 |
| 2015 | $2,044 | $183,948 | $47,290 | $136,658 |
| 2014 | $1,970 | $178,591 | $0 | $0 |
| 2013 | -- | $173,390 | $0 | $0 |
Source: Public Records
Map
Nearby Homes
- 90153 Lake Shore Ct
- 90171 Lake Shore Ct
- 33874 Southshore Dr
- 33864 Southshore Dr
- 33860 Southshore Dr
- 33878 Southshore Dr
- 90151 Lake Shore Ct
- 90181 Lake Shore Ct
- 90168 Lake Shore Ct
- 90160 Lake Shore Ct
- 90167 Hawkins Rd
- 33850 Southshore Dr
- 33886 Southshore Dr
- 90142 Lake Shore Ct
- 90147 Lake Shore Ct
- 33867 Southshore Dr
- 33859 Southshore Dr
- 90132 Lake Shore Ct
- 33873 Southshore Dr
- 90157 Hawkins Rd