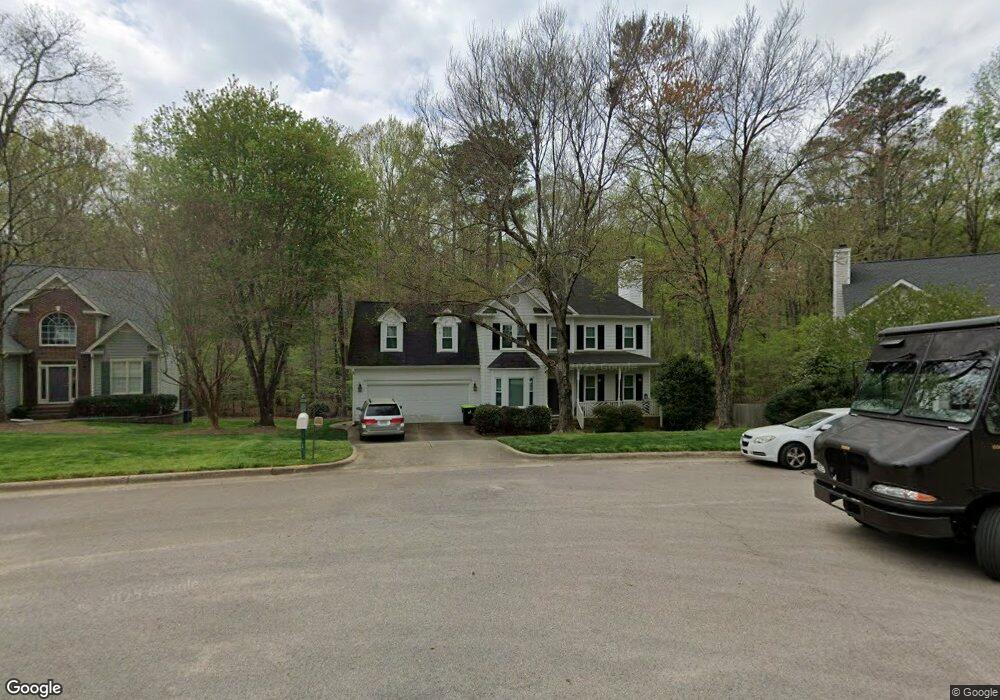
9017 Branch Creek Way Apex, NC 27539
Middle Creek NeighborhoodEstimated Value: $509,000 - $640,000
4
Beds
3
Baths
2,177
Sq Ft
$251/Sq Ft
Est. Value
About This Home
This home is located at 9017 Branch Creek Way, Apex, NC 27539 and is currently estimated at $546,893, approximately $251 per square foot. 9017 Branch Creek Way is a home located in Wake County with nearby schools including Yates Mill Elementary School, Dillard Drive Magnet Middle School, and Middle Creek High.
Ownership History
Date
Name
Owned For
Owner Type
Purchase Details
Closed on
Oct 25, 2002
Sold by
Slater Ted M and Slater Kelly A
Bought by
Johnson Christopher L and Johnson Kristin K
Current Estimated Value
Home Financials for this Owner
Home Financials are based on the most recent Mortgage that was taken out on this home.
Original Mortgage
$172,000
Outstanding Balance
$73,050
Interest Rate
6.21%
Estimated Equity
$473,843
Purchase Details
Closed on
May 12, 1999
Sold by
Whetstone Kyle D and Whetstone Lisa A
Bought by
Slater Ted M and Slater Kelly A
Home Financials for this Owner
Home Financials are based on the most recent Mortgage that was taken out on this home.
Original Mortgage
$177,750
Interest Rate
7.04%
Purchase Details
Closed on
Oct 31, 1997
Sold by
Joy Mar Homes Inc
Bought by
Whetstone Kyle D and Whetstone Lisa A
Home Financials for this Owner
Home Financials are based on the most recent Mortgage that was taken out on this home.
Original Mortgage
$160,000
Interest Rate
7.39%
Create a Home Valuation Report for This Property
The Home Valuation Report is an in-depth analysis detailing your home's value as well as a comparison with similar homes in the area
Home Values in the Area
Average Home Value in this Area
Purchase History
| Date | Buyer | Sale Price | Title Company |
|---|---|---|---|
| Johnson Christopher L | $215,000 | -- | |
| Slater Ted M | $197,500 | -- | |
| Whetstone Kyle D | $186,000 | -- |
Source: Public Records
Mortgage History
| Date | Status | Borrower | Loan Amount |
|---|---|---|---|
| Open | Johnson Christopher L | $172,000 | |
| Closed | Johnson Christopher L | $32,250 | |
| Previous Owner | Slater Ted M | $177,750 | |
| Previous Owner | Whetstone Kyle D | $160,000 |
Source: Public Records
Tax History Compared to Growth
Tax History
| Year | Tax Paid | Tax Assessment Tax Assessment Total Assessment is a certain percentage of the fair market value that is determined by local assessors to be the total taxable value of land and additions on the property. | Land | Improvement |
|---|---|---|---|---|
| 2025 | $3,074 | $477,473 | $175,000 | $302,473 |
| 2024 | $2,985 | $477,473 | $175,000 | $302,473 |
| 2023 | $2,529 | $321,815 | $75,000 | $246,815 |
| 2022 | $2,344 | $321,815 | $75,000 | $246,815 |
| 2021 | $2,281 | $321,815 | $75,000 | $246,815 |
| 2020 | $2,244 | $321,815 | $75,000 | $246,815 |
| 2019 | $2,103 | $255,093 | $70,000 | $185,093 |
| 2018 | $1,934 | $255,093 | $70,000 | $185,093 |
| 2017 | $1,834 | $255,093 | $70,000 | $185,093 |
| 2016 | $1,797 | $255,093 | $70,000 | $185,093 |
| 2015 | $1,694 | $241,089 | $54,000 | $187,089 |
| 2014 | $1,606 | $241,089 | $54,000 | $187,089 |
Source: Public Records
Map
Nearby Homes
- 116 Vintage Hill Cir
- 1029 Dozier Way
- 3208 Treewood Ln
- 1108 Bradshaw Ct
- 4104 Belnap Dr
- 3901 Bamburgh Ln
- 4425 Surry Ridge Cir
- 4104 Green Chase Way
- 4028 Franks Creek Dr Unit Lot 44
- 1023 Augustine Trail
- 612 Hawks Ridge Ct
- 112 Sonoma Valley Dr
- 3645 S Pointe Dr
- 5308 Amsterdam Place
- 3920 Rustic Mill Dr
- 229 Shillings Chase Dr
- 222 Shillings Chase Dr
- 102 Travilah Oaks Ln
- 103 Moss Rose Ct
- 207 Forest Run Place
- 9013 Branch Creek Way
- 9021 Branch Creek Way
- 9009 Branch Creek Way
- 9012 Branch Creek Way
- 9025 Branch Creek Way
- 9005 Branch Creek Way
- 9016 Branch Creek Way
- 4213 Winding Oak Way
- 4217 Winding Oak Way
- 9008 Oak Branch Dr
- 9004 Oak Branch Dr
- 9012 Oak Branch Dr
- 118 Vintage Hill Cir
- 9000 Oak Branch Dr
- 114 Vintage Hill Cir
- 120 Vintage Hill Cir
- 4212 Winding Oak Way
- 4208 Winding Oak Way
- 9016 Oak Branch Dr
- 4204 Winding Oak Way