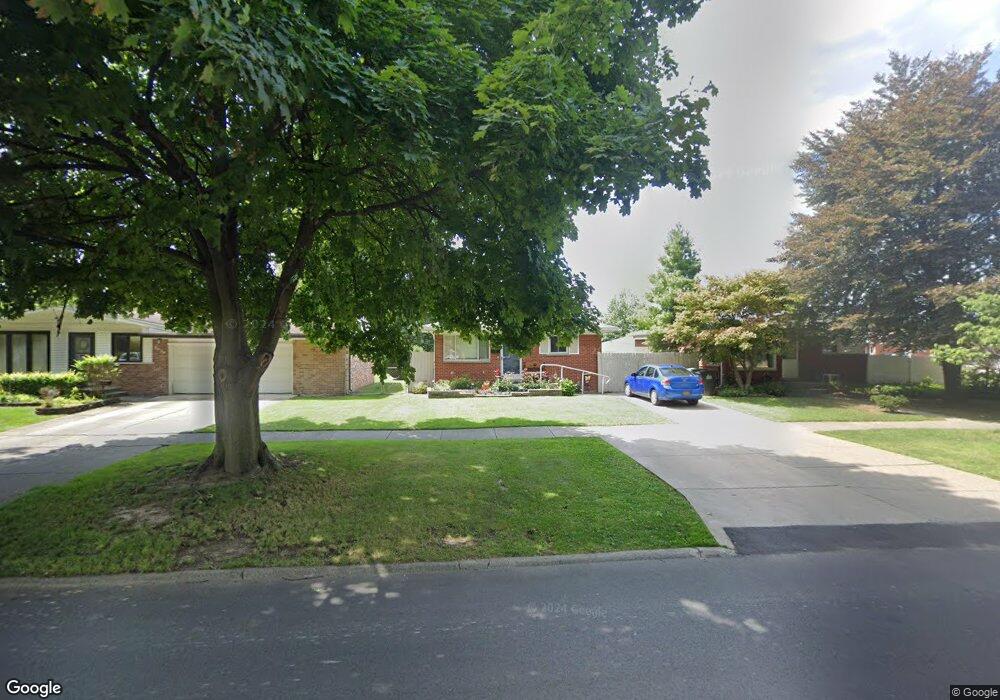
9018 Monroe Blvd Taylor, MI 48180
Estimated Value: $175,000 - $221,000
3
Beds
1
Bath
986
Sq Ft
$192/Sq Ft
Est. Value
About This Home
This home is located at 9018 Monroe Blvd, Taylor, MI 48180 and is currently estimated at $189,082, approximately $191 per square foot. 9018 Monroe Blvd is a home located in Wayne County with nearby schools including Clarence Randall Elementary School, Robert J. West Middle School, and Taylor High School.
Ownership History
Date
Name
Owned For
Owner Type
Purchase Details
Closed on
Feb 13, 2019
Sold by
Basnaw Creston C
Bought by
Basnaw Creston C and Mount Laura Catherine
Current Estimated Value
Purchase Details
Closed on
Sep 29, 2010
Sold by
Donovan Shaun and Secretary Of Housing & Urban D
Bought by
Basnaw Creston C
Purchase Details
Closed on
Mar 12, 2010
Sold by
Flagstar Bank Fsb
Bought by
Us Department Of Housing & Urban Develop
Purchase Details
Closed on
Jan 15, 2010
Sold by
Mortgage Electronic Registration Systems
Bought by
Flagstar Bank Fsb
Purchase Details
Closed on
Jul 8, 2009
Sold by
Merrihew Ricky K
Bought by
Mortgage Electronic Registration Systems
Purchase Details
Closed on
Nov 22, 2004
Sold by
Rima Edward J and The Edward J Rima Trust
Bought by
Merrihew Ricky K
Purchase Details
Closed on
Mar 20, 2003
Sold by
Rima Edward J and Estate Of Elizabeth Stone Rima
Bought by
The Edward J Rima Trust
Create a Home Valuation Report for This Property
The Home Valuation Report is an in-depth analysis detailing your home's value as well as a comparison with similar homes in the area
Home Values in the Area
Average Home Value in this Area
Purchase History
| Date | Buyer | Sale Price | Title Company |
|---|---|---|---|
| Basnaw Creston C | -- | None Available | |
| Basnaw Creston C | $38,000 | None Available | |
| Us Department Of Housing & Urban Develop | -- | None Available | |
| Flagstar Bank Fsb | -- | None Available | |
| Mortgage Electronic Registration Systems | $118,263 | None Available | |
| Merrihew Ricky K | $125,000 | Multiple | |
| The Edward J Rima Trust | -- | -- |
Source: Public Records
Tax History Compared to Growth
Tax History
| Year | Tax Paid | Tax Assessment Tax Assessment Total Assessment is a certain percentage of the fair market value that is determined by local assessors to be the total taxable value of land and additions on the property. | Land | Improvement |
|---|---|---|---|---|
| 2025 | $1,553 | $80,400 | $0 | $0 |
| 2024 | $1,553 | $74,200 | $0 | $0 |
| 2023 | $1,852 | $67,700 | $0 | $0 |
| 2022 | $1,482 | $58,500 | $0 | $0 |
| 2021 | $2,429 | $52,600 | $0 | $0 |
| 2020 | $2,568 | $47,100 | $0 | $0 |
| 2019 | $249,522 | $41,900 | $0 | $0 |
| 2018 | $1,813 | $34,700 | $0 | $0 |
| 2017 | $2,429 | $33,600 | $0 | $0 |
| 2016 | $3,356 | $32,700 | $0 | $0 |
| 2015 | $2,875 | $29,200 | $0 | $0 |
| 2013 | $2,860 | $29,200 | $0 | $0 |
| 2012 | $1,876 | $28,800 | $7,000 | $21,800 |
Source: Public Records
Map
Nearby Homes
- 22134 Wick Rd
- 9125 Dudley St
- 22311 Wick Rd
- 22327 Wick Rd
- 9381 Pardee Rd
- 22382 Mary St
- 8818 Clippert St
- 8316 Roosevelt St
- 22150 Haig St
- 22726 Haskell St
- 8910 Mason St
- 9167 Groschner St
- 21059 Wick Rd
- 9560 Sylvester St
- 20968 Shannon St
- 23210 Mary St
- 20812 Wick Rd
- 9883 Roosevelt St
- 22931 Champaign St
- 9942 Lincoln St
- 9010 Monroe Blvd
- 9030 Monroe Blvd
- 9038 Monroe Blvd
- 9011 Roosevelt St
- 9019 Roosevelt St
- 9003 Roosevelt St
- 9027 Roosevelt St
- 9046 Monroe Blvd
- 8912 Monroe Blvd
- 9035 Roosevelt St
- 9023 Monroe Blvd
- 9015 Monroe Blvd
- 9054 Monroe Blvd
- 9007 Monroe Blvd
- 9033 Monroe Blvd
- 22026 Mary St
- 9045 Roosevelt St
- 9039 Monroe Blvd
- 8900 Monroe Blvd
- 22036 Mary St