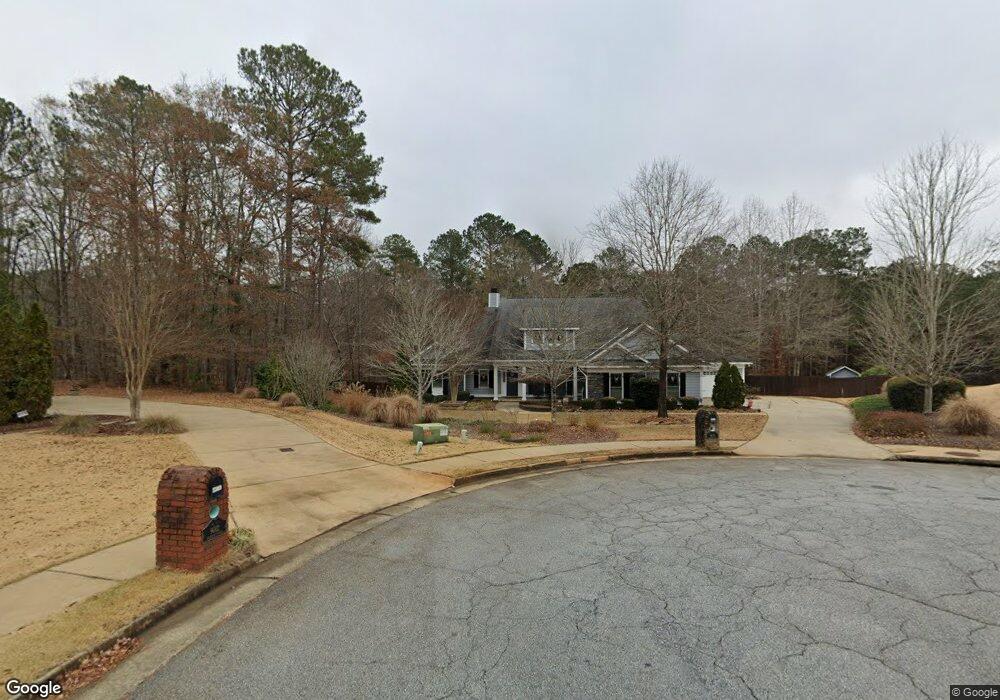
9018 Splendor Ct Columbus, GA 31904
Northern Columbus NeighborhoodEstimated Value: $458,373 - $504,000
4
Beds
4
Baths
3,175
Sq Ft
$151/Sq Ft
Est. Value
About This Home
This home is located at 9018 Splendor Ct, Columbus, GA 31904 and is currently estimated at $480,124, approximately $151 per square foot. 9018 Splendor Ct is a home located in Muscogee County with nearby schools including North Columbus Elementary School, Veterans Memorial Middle School, and Northside High School.
Ownership History
Date
Name
Owned For
Owner Type
Purchase Details
Closed on
Jun 25, 2015
Sold by
Goodrich Timothy W
Bought by
Wagner Lewis George and Wagner Vickie Lynn
Current Estimated Value
Home Financials for this Owner
Home Financials are based on the most recent Mortgage that was taken out on this home.
Original Mortgage
$389,500
Outstanding Balance
$303,497
Interest Rate
3.92%
Estimated Equity
$176,627
Purchase Details
Closed on
May 20, 2010
Sold by
Leary & Brown Inc
Bought by
Goodrich Timothy W and Goodrich Wendy M
Home Financials for this Owner
Home Financials are based on the most recent Mortgage that was taken out on this home.
Original Mortgage
$423,922
Interest Rate
5.15%
Mortgage Type
VA
Purchase Details
Closed on
Oct 22, 2009
Sold by
Dykes Builders Inc
Bought by
Leary & Brown Inc
Create a Home Valuation Report for This Property
The Home Valuation Report is an in-depth analysis detailing your home's value as well as a comparison with similar homes in the area
Home Values in the Area
Average Home Value in this Area
Purchase History
| Date | Buyer | Sale Price | Title Company |
|---|---|---|---|
| Wagner Lewis George | $410,000 | -- | |
| Goodrich Timothy W | $430,600 | None Available | |
| Leary & Brown Inc | $98,500 | None Available |
Source: Public Records
Mortgage History
| Date | Status | Borrower | Loan Amount |
|---|---|---|---|
| Open | Wagner Lewis George | $389,500 | |
| Previous Owner | Goodrich Timothy W | $423,922 |
Source: Public Records
Tax History Compared to Growth
Tax History
| Year | Tax Paid | Tax Assessment Tax Assessment Total Assessment is a certain percentage of the fair market value that is determined by local assessors to be the total taxable value of land and additions on the property. | Land | Improvement |
|---|---|---|---|---|
| 2025 | $5,601 | $174,652 | $19,812 | $154,840 |
| 2024 | $5,600 | $174,652 | $19,812 | $154,840 |
| 2023 | $494 | $174,652 | $19,812 | $154,840 |
| 2022 | $4,987 | $147,256 | $19,812 | $127,444 |
| 2021 | $4,980 | $126,764 | $19,812 | $106,952 |
| 2020 | $4,982 | $126,764 | $19,812 | $106,952 |
| 2019 | $5,002 | $126,764 | $19,812 | $106,952 |
| 2018 | $6,204 | $131,680 | $38,804 | $92,876 |
| 2017 | $6,225 | $131,680 | $38,804 | $92,876 |
| 2016 | $6,218 | $164,000 | $30,000 | $134,000 |
| 2015 | $7,114 | $172,240 | $30,000 | $142,240 |
| 2014 | -- | $172,240 | $30,000 | $142,240 |
| 2013 | -- | $172,240 | $30,000 | $142,240 |
Source: Public Records
Map
Nearby Homes
- 7170 Bridgemill Dr
- Belmont Plan at Heiferhorn Farms
- Cypress Plan at Heiferhorn Farms
- Harrison Plan at Heiferhorn Farms
- Oakwood Plan at Heiferhorn Farms
- Maple Plan at Heiferhorn Farms
- Spruce Plan at Heiferhorn Farms
- Aspen Plan at Heiferhorn Farms
- Jackson Plan at Heiferhorn Farms
- Alder Plan at Heiferhorn Farms
- Ash II Plan at Heiferhorn Farms
- Camden Plan at Heiferhorn Farms
- Cannaberra Plan at Heiferhorn Farms
- 4015 Holstein Hill
- 4023 Holstein Hill Unit 180
- 4023 Holstein Hill
- 4102 Holstein Hill
- 4094 Holstein Hill
- 4102 Holstein Hill Unit 114
- 4138 Holstein Hill
- 9019 Splendor Ct
- 9012 Splendor Ct
- 9013 Splendor Ct
- 9006 Splendor Ct
- 7068 Bridgemill Dr
- 7062 Bridgemill Dr
- 9007 Splendor Ct
- 7056 Bridgemill Way
- 9021 Cimarron Ct
- 8014 Splendor Way
- 7050 Bridgemill Dr
- 9001 Splendor Ct
- 9011 Cimarron Ct
- 9027 Cimarron Ct
- 9003 Cimarron Ct
- 8018 Splendor Way
- 7044 Bridgemill Dr
- 7069 Bridgemill Dr
- 8002 Splendor Way
- 9012 Cimarron Ct