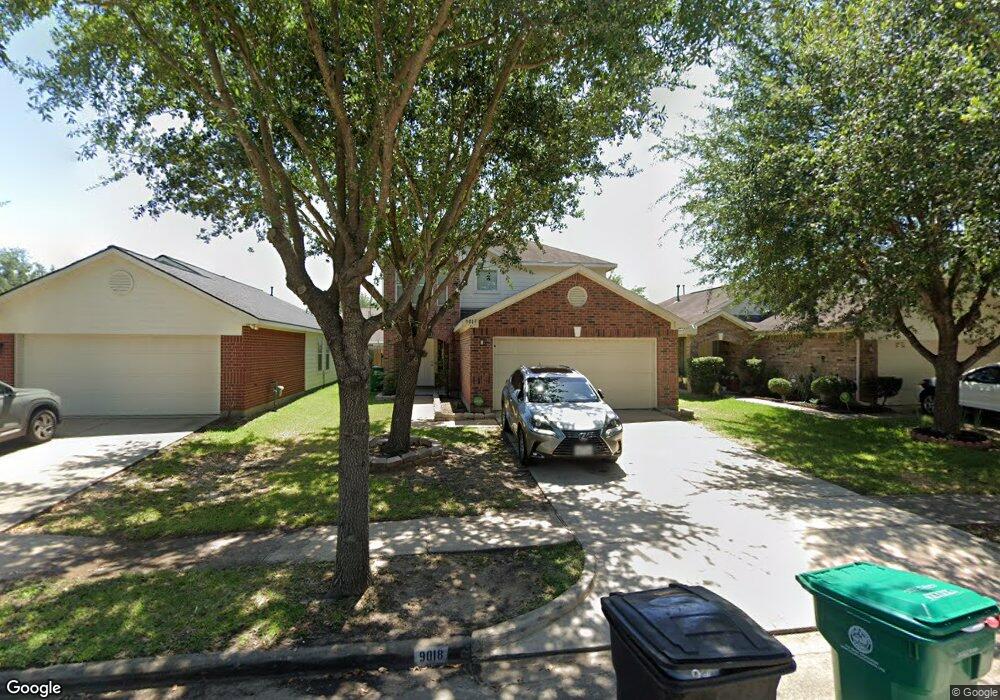
9018 Sporan Ln Houston, TX 77075
Southbelt-Ellington NeighborhoodEstimated Value: $258,277 - $292,000
4
Beds
3
Baths
1,860
Sq Ft
$147/Sq Ft
Est. Value
About This Home
This home is located at 9018 Sporan Ln, Houston, TX 77075 and is currently estimated at $274,069, approximately $147 per square foot. 9018 Sporan Ln is a home located in Harris County with nearby schools including Laura Welch Bush Elementary School, Morris Middle School, and Beverly Hill Intermediate School.
Ownership History
Date
Name
Owned For
Owner Type
Purchase Details
Closed on
Jul 7, 2017
Sold by
Truong Dieu Tuyet
Bought by
Villalobos Jose and Villalobos Jose
Current Estimated Value
Home Financials for this Owner
Home Financials are based on the most recent Mortgage that was taken out on this home.
Original Mortgage
$166,666
Outstanding Balance
$138,699
Interest Rate
3.95%
Mortgage Type
FHA
Estimated Equity
$135,370
Purchase Details
Closed on
Jan 17, 2017
Sold by
Bank Of America Na
Bought by
Truong Dieu Tuyet
Purchase Details
Closed on
Dec 13, 2016
Sold by
Vargas Luis and Bustamante Olga
Bought by
Prlap Inc
Purchase Details
Closed on
Jul 3, 2007
Sold by
Beazer Homes Texas Lp
Bought by
Vargas Luis and Bustamante Olga L
Home Financials for this Owner
Home Financials are based on the most recent Mortgage that was taken out on this home.
Original Mortgage
$134,405
Interest Rate
6.37%
Mortgage Type
FHA
Create a Home Valuation Report for This Property
The Home Valuation Report is an in-depth analysis detailing your home's value as well as a comparison with similar homes in the area
Home Values in the Area
Average Home Value in this Area
Purchase History
| Date | Buyer | Sale Price | Title Company |
|---|---|---|---|
| Villalobos Jose | -- | Stewart Title | |
| Truong Dieu Tuyet | -- | None Available | |
| Prlap Inc | $142,936 | None Available | |
| Vargas Luis | -- | Etc |
Source: Public Records
Mortgage History
| Date | Status | Borrower | Loan Amount |
|---|---|---|---|
| Open | Villalobos Jose | $166,666 | |
| Previous Owner | Vargas Luis | $134,405 |
Source: Public Records
Tax History Compared to Growth
Tax History
| Year | Tax Paid | Tax Assessment Tax Assessment Total Assessment is a certain percentage of the fair market value that is determined by local assessors to be the total taxable value of land and additions on the property. | Land | Improvement |
|---|---|---|---|---|
| 2025 | $7,614 | $261,815 | $37,332 | $224,483 |
| 2024 | $7,614 | $261,815 | $37,332 | $224,483 |
| 2023 | $7,614 | $257,443 | $37,332 | $220,111 |
| 2022 | $7,270 | $239,136 | $37,332 | $201,804 |
| 2021 | $6,414 | $200,030 | $32,940 | $167,090 |
| 2020 | $6,241 | $186,797 | $32,940 | $153,857 |
| 2019 | $6,332 | $180,779 | $28,548 | $152,231 |
| 2018 | $2,215 | $157,866 | $26,352 | $131,514 |
| 2017 | $5,342 | $157,866 | $26,352 | $131,514 |
| 2016 | $5,169 | $152,736 | $21,960 | $130,776 |
| 2015 | $4,107 | $141,853 | $21,960 | $119,893 |
| 2014 | $4,107 | $115,941 | $21,960 | $93,981 |
Source: Public Records
Map
Nearby Homes
- 8718 Black Cliff Ln
- 10847 Nellsfield Ln
- 10858 Shannon Mills Ln
- 8626 Valley Crest Ln
- 10806 Tallow Briar
- 9307 Fuqua Ridge Ln
- 001 Fuqua St
- 9130 Garden Breeze Dr
- 8615 Tartan Walk Ln
- 8612 Fuqua St
- 10506 Pleasant Villas Ln
- 0 Fuqua St Unit 64883593
- 0 Fuqua St Unit 45902141
- 0 Fuqua St Unit 97219329
- 10934 Bradford Way Dr
- 11115 Opal Glen Ln
- 8420 Fuqua St
- 10918 Linden Gate Dr
- 7329 Madison Commons Ln
- 7322 Madison Commons Ln
- 9014 Sporan Ln
- 9022 Sporan Ln
- 9010 Sporan Ln
- 9019 Durham Manor Ln
- 9023 Durham Manor Ln
- 9006 Sporan Ln
- 9015 Durham Manor Ln
- 8927 Doak Ln
- 9019 Sporan Ln
- 9015 Sporan Ln
- 9002 Sporan Ln
- 9011 Durham Manor Ln
- 9023 Sporan Ln
- 8923 Doak Ln
- 9011 Sporan Ln
- 8931 Doak Ln
- 8919 Doak Ln
- 8935 Doak Ln
- 8911 Doak Ln
- 9007 Sporan Ln