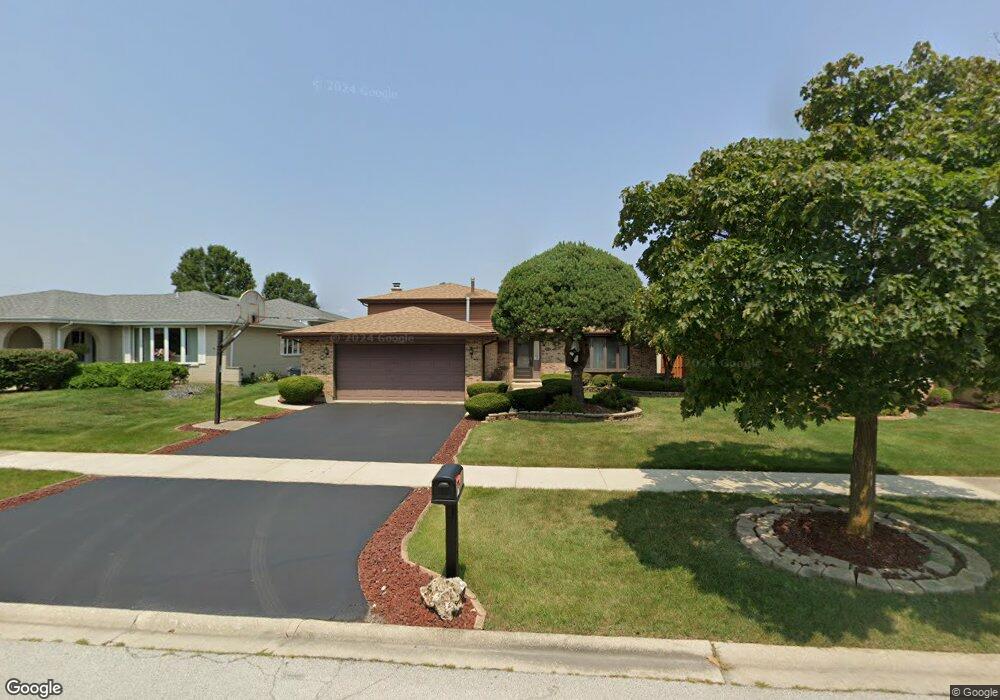
9018 Westwood Dr Orland Hills, IL 60487
Estimated Value: $365,000 - $383,000
3
Beds
2
Baths
1,420
Sq Ft
$264/Sq Ft
Est. Value
About This Home
This home is located at 9018 Westwood Dr, Orland Hills, IL 60487 and is currently estimated at $374,291, approximately $263 per square foot. 9018 Westwood Dr is a home located in Cook County with nearby schools including Fernway Park Elementary School, Prairie View Middle School, and Victor J Andrew High School.
Ownership History
Date
Name
Owned For
Owner Type
Purchase Details
Closed on
Nov 20, 2003
Sold by
Layman Robert F and Lewis Layman Elizabeth
Bought by
Layman Robert F and Lewis Layman Elizabeth
Current Estimated Value
Purchase Details
Closed on
Jul 24, 1996
Sold by
Federal National Mortgage Association
Bought by
Layman Robert F and Lewis Layman Elizabeth
Home Financials for this Owner
Home Financials are based on the most recent Mortgage that was taken out on this home.
Original Mortgage
$77,000
Outstanding Balance
$5,661
Interest Rate
8.43%
Estimated Equity
$368,630
Purchase Details
Closed on
Mar 25, 1996
Sold by
Mackiney Peter J and Mackiney Pamela F
Bought by
Federal National Mortgage Association
Purchase Details
Closed on
Aug 25, 1994
Sold by
Rybka Donald R and Rybka Karen L
Bought by
Mackiney Peter J and Mackiney Pamela F
Home Financials for this Owner
Home Financials are based on the most recent Mortgage that was taken out on this home.
Original Mortgage
$142,500
Interest Rate
8.72%
Create a Home Valuation Report for This Property
The Home Valuation Report is an in-depth analysis detailing your home's value as well as a comparison with similar homes in the area
Home Values in the Area
Average Home Value in this Area
Purchase History
| Date | Buyer | Sale Price | Title Company |
|---|---|---|---|
| Layman Robert F | -- | -- | |
| Layman Robert F | -- | -- | |
| Federal National Mortgage Association | -- | -- | |
| Mackiney Peter J | -- | -- |
Source: Public Records
Mortgage History
| Date | Status | Borrower | Loan Amount |
|---|---|---|---|
| Open | Layman Robert F | $77,000 | |
| Previous Owner | Mackiney Peter J | $142,500 |
Source: Public Records
Tax History Compared to Growth
Tax History
| Year | Tax Paid | Tax Assessment Tax Assessment Total Assessment is a certain percentage of the fair market value that is determined by local assessors to be the total taxable value of land and additions on the property. | Land | Improvement |
|---|---|---|---|---|
| 2024 | $6,800 | $31,000 | $5,231 | $25,769 |
| 2023 | $5,593 | $31,000 | $5,231 | $25,769 |
| 2022 | $5,593 | $22,417 | $4,263 | $18,154 |
| 2021 | $5,389 | $22,416 | $4,262 | $18,154 |
| 2020 | $5,325 | $22,416 | $4,262 | $18,154 |
| 2019 | $5,606 | $23,773 | $3,875 | $19,898 |
| 2018 | $5,428 | $23,773 | $3,875 | $19,898 |
| 2017 | $5,269 | $23,773 | $3,875 | $19,898 |
| 2016 | $5,443 | $21,422 | $3,487 | $17,935 |
| 2015 | $5,318 | $21,422 | $3,487 | $17,935 |
| 2014 | $5,285 | $21,422 | $3,487 | $17,935 |
| 2013 | $5,268 | $22,824 | $3,487 | $19,337 |
Source: Public Records
Map
Nearby Homes
- 16950 90th Ave
- 16805 Hilltop Ave
- 17230 Shetland Dr
- 17018 93rd Ave
- 16813 89th Ave
- 16779 92nd Ave
- 16753 Hilltop Ave
- 16753 91st Ave
- 8750 W 169th St
- 16701 Highview Ave
- 8721 W 169th St
- 17224 Briar Dr
- 9413 Caledonia Dr
- 8710 W 168th St
- 9404 Lindsay St
- 17324 Humber Ln
- 9201 175th St
- 8548 Bethany Ln
- 17533 Pecan Ln
- 9334 Drummond Dr Unit 3
- 9012 Westwood Dr
- 9024 Westwood Dr
- 9006 Westwood Dr
- 9030 Westwood Dr
- 9019 Westwood Dr
- 9013 Westwood Dr
- 9025 Westwood Dr
- 9036 Westwood Dr
- 9007 Westwood Dr
- 9031 Westwood Dr
- 9005 Westwood Dr
- 9037 Westwood Dr
- 17028 Redwood Ct
- 17020 Redwood Ct
- 17012 Redwood Ct
- 17043 Westwood Dr
- 17006 Redwood Ct
- 17037 Westwood Dr
- 9101 Westwood Dr
- 17031 Westwood Dr