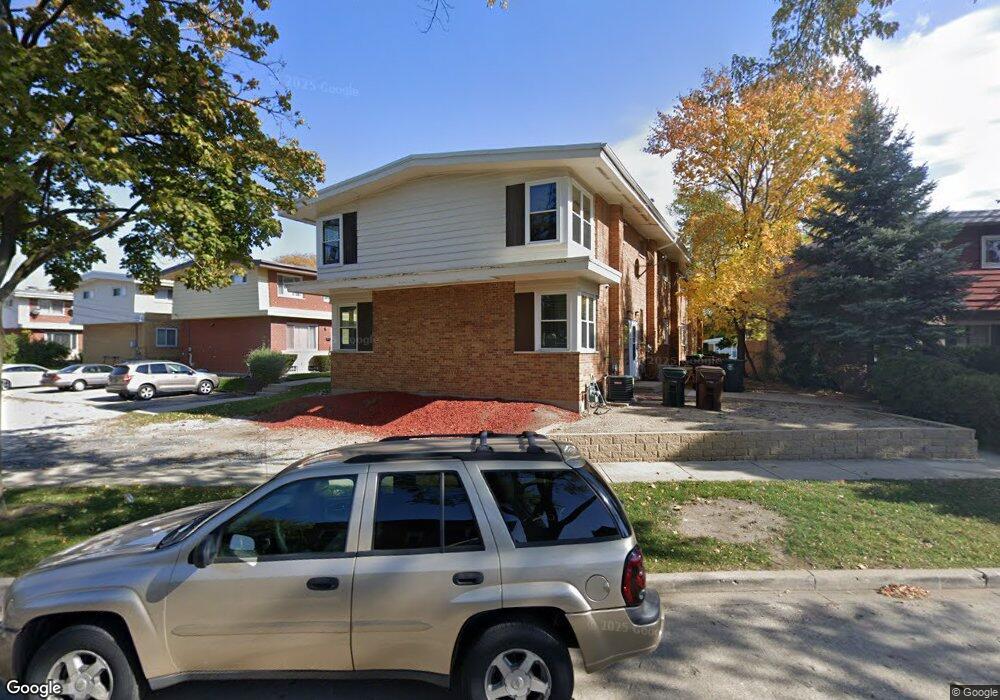
9019 Keating Ave Skokie, IL 60076
Southwest Skokie NeighborhoodEstimated Value: $309,540 - $344,000
3
Beds
1
Bath
1,109
Sq Ft
$296/Sq Ft
Est. Value
About This Home
This home is located at 9019 Keating Ave, Skokie, IL 60076 and is currently estimated at $328,635, approximately $296 per square foot. 9019 Keating Ave is a home located in Cook County with nearby schools including Old Orchard Jr High School, Devonshire Elementary School, and Niles North High School.
Ownership History
Date
Name
Owned For
Owner Type
Purchase Details
Closed on
Dec 13, 2004
Sold by
Parikh Dilipkumar K and Parikh Pratibha D
Bought by
Kant Kalpesh
Current Estimated Value
Home Financials for this Owner
Home Financials are based on the most recent Mortgage that was taken out on this home.
Original Mortgage
$200,800
Outstanding Balance
$99,017
Interest Rate
5.5%
Mortgage Type
New Conventional
Estimated Equity
$229,618
Purchase Details
Closed on
Jun 23, 2000
Sold by
Khnykin Oleg and Khnykin Irina
Bought by
Parikh Dilipkumar K and Parikh Pratibha D
Home Financials for this Owner
Home Financials are based on the most recent Mortgage that was taken out on this home.
Original Mortgage
$129,600
Interest Rate
8.12%
Purchase Details
Closed on
May 23, 1997
Sold by
Muller Leonid and Muller Elfrida
Bought by
Khnykin Oleg and Khnykin Irina
Home Financials for this Owner
Home Financials are based on the most recent Mortgage that was taken out on this home.
Original Mortgage
$123,300
Interest Rate
7.62%
Create a Home Valuation Report for This Property
The Home Valuation Report is an in-depth analysis detailing your home's value as well as a comparison with similar homes in the area
Home Values in the Area
Average Home Value in this Area
Purchase History
| Date | Buyer | Sale Price | Title Company |
|---|---|---|---|
| Kant Kalpesh | $251,000 | Multiple | |
| Parikh Dilipkumar K | $162,000 | -- | |
| Khnykin Oleg | $137,000 | -- |
Source: Public Records
Mortgage History
| Date | Status | Borrower | Loan Amount |
|---|---|---|---|
| Open | Kant Kalpesh | $200,800 | |
| Previous Owner | Parikh Dilipkumar K | $129,600 | |
| Previous Owner | Khnykin Oleg | $123,300 | |
| Closed | Kant Kalpesh | $25,100 |
Source: Public Records
Tax History Compared to Growth
Tax History
| Year | Tax Paid | Tax Assessment Tax Assessment Total Assessment is a certain percentage of the fair market value that is determined by local assessors to be the total taxable value of land and additions on the property. | Land | Improvement |
|---|---|---|---|---|
| 2024 | $5,168 | $24,000 | $4,000 | $20,000 |
| 2023 | $5,004 | $24,000 | $4,000 | $20,000 |
| 2022 | $5,004 | $24,000 | $4,000 | $20,000 |
| 2021 | $4,056 | $18,150 | $1,947 | $16,203 |
| 2020 | $4,078 | $18,150 | $1,947 | $16,203 |
| 2019 | $4,180 | $20,394 | $1,947 | $18,447 |
| 2018 | $3,929 | $18,018 | $1,764 | $16,254 |
| 2017 | $3,973 | $18,018 | $1,764 | $16,254 |
| 2016 | $4,027 | $18,018 | $1,764 | $16,254 |
| 2015 | $3,628 | $15,622 | $1,521 | $14,101 |
| 2014 | $3,559 | $15,622 | $1,521 | $14,101 |
| 2013 | $3,534 | $15,622 | $1,521 | $14,101 |
Source: Public Records
Map
Nearby Homes
- 4801 Grove St
- 9161 Kilpatrick Ave
- 9012 Lamon Ave
- 8914 La Crosse Ave Unit 2S
- 8940 Lamon Ave
- 9011 Bronx Ave
- 8950 Lavergne Ave
- 8836 Bronx Ave
- 9234 Kolmar Ave
- 8710 Skokie Blvd Unit 3BS
- 9244 Gross Point Rd Unit A103
- 4901 Carol Unit F St
- 8644 Skokie Blvd
- 4343 Davis St
- 4354 Lyons St
- 5032 Crain St
- 4310 Church St
- 9445 Kenton Ave Unit P30
- 9445 Kenton Ave Unit P14
- 9457 Kenton Ave Unit F
- 9021 Keating Ave
- 9022 Niles Center Rd
- 9017 Keating Ave
- 9020 Niles Center Rd
- 9026 Niles Center Rd
- 9026 Niles Center Rd
- 9015 Keating Ave
- 9018 Niles Center Rd
- 9024 Niles Center Rd
- 9024 Niles Center Rd
- 9024 Niles Center Rd Unit 9024
- 9013 Keating Ave
- 9009 Keating Ave
- 9009 Keating Ave Unit D
- 9032 Niles Center Rd
- 9032 Niles Center Rd
- 9032 Niles Center Rd Unit A
- 9030 Niles Center Rd
- 9030 Niles Center Rd
- 9007 Keating Ave