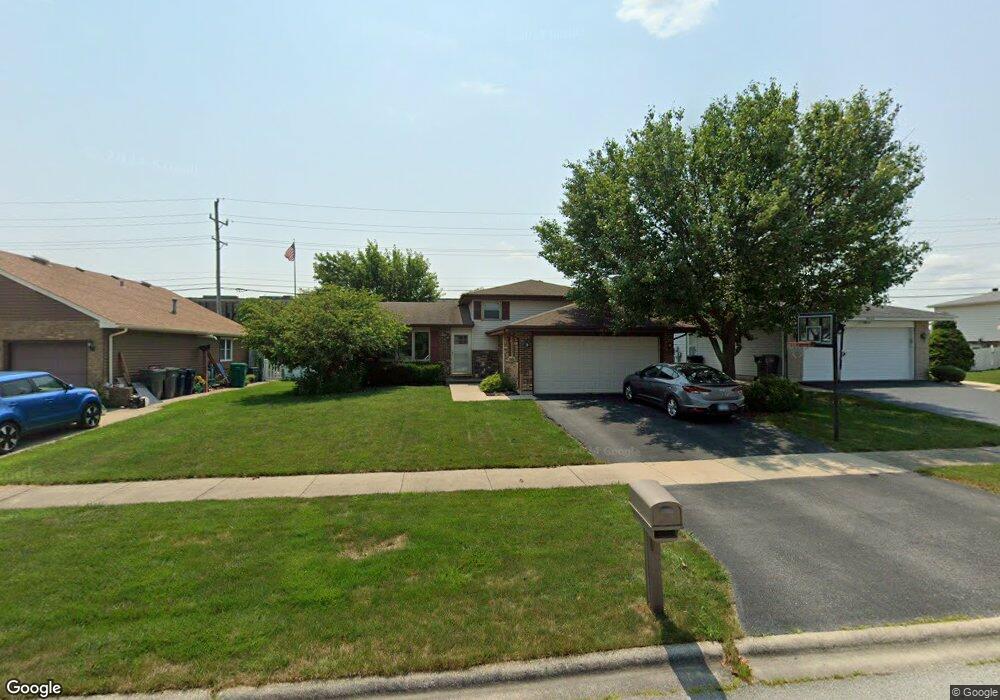
9019 Westwood Dr Orland Hills, IL 60487
Estimated Value: $291,000 - $341,000
3
Beds
1
Bath
1,222
Sq Ft
$258/Sq Ft
Est. Value
About This Home
This home is located at 9019 Westwood Dr, Orland Hills, IL 60487 and is currently estimated at $315,459, approximately $258 per square foot. 9019 Westwood Dr is a home located in Cook County with nearby schools including Fernway Park Elementary School, Prairie View Middle School, and Victor J Andrew High School.
Ownership History
Date
Name
Owned For
Owner Type
Purchase Details
Closed on
Aug 24, 2021
Sold by
Obrien William A and Obrien Margaret M
Bought by
Obrien Brandon J
Current Estimated Value
Home Financials for this Owner
Home Financials are based on the most recent Mortgage that was taken out on this home.
Original Mortgage
$184,000
Outstanding Balance
$167,858
Interest Rate
3.12%
Mortgage Type
New Conventional
Estimated Equity
$147,601
Purchase Details
Closed on
Feb 29, 2012
Sold by
Obrien William A and Obrien Margaret M
Bought by
Obrien William A and Obrien Margaret M
Purchase Details
Closed on
Nov 17, 1995
Sold by
Conner Paller Nancy M and Conner Nancy M
Bought by
Obrien William A and Obrien Margaret M
Home Financials for this Owner
Home Financials are based on the most recent Mortgage that was taken out on this home.
Original Mortgage
$128,000
Interest Rate
7.56%
Create a Home Valuation Report for This Property
The Home Valuation Report is an in-depth analysis detailing your home's value as well as a comparison with similar homes in the area
Home Values in the Area
Average Home Value in this Area
Purchase History
| Date | Buyer | Sale Price | Title Company |
|---|---|---|---|
| Obrien Brandon J | $230,000 | Chicago Title | |
| Obrien William A | -- | None Available | |
| Obrien William A | $146,000 | Attorneys Natl Title Network |
Source: Public Records
Mortgage History
| Date | Status | Borrower | Loan Amount |
|---|---|---|---|
| Open | Obrien Brandon J | $184,000 | |
| Previous Owner | Obrien William A | $128,000 |
Source: Public Records
Tax History Compared to Growth
Tax History
| Year | Tax Paid | Tax Assessment Tax Assessment Total Assessment is a certain percentage of the fair market value that is determined by local assessors to be the total taxable value of land and additions on the property. | Land | Improvement |
|---|---|---|---|---|
| 2024 | $5,493 | $23,001 | $5,063 | $17,938 |
| 2023 | $5,291 | $23,001 | $5,063 | $17,938 |
| 2022 | $5,291 | $18,155 | $4,125 | $14,030 |
| 2021 | $5,071 | $18,155 | $4,125 | $14,030 |
| 2020 | $4,945 | $18,155 | $4,125 | $14,030 |
| 2019 | $5,563 | $20,894 | $3,750 | $17,144 |
| 2018 | $5,388 | $20,894 | $3,750 | $17,144 |
| 2017 | $5,216 | $20,894 | $3,750 | $17,144 |
| 2016 | $4,538 | $16,789 | $3,375 | $13,414 |
| 2015 | $4,451 | $16,789 | $3,375 | $13,414 |
| 2014 | $4,416 | $16,789 | $3,375 | $13,414 |
| 2013 | $4,822 | $19,395 | $3,375 | $16,020 |
Source: Public Records
Map
Nearby Homes
- 16950 90th Ave
- 17230 Shetland Dr
- 16805 Hilltop Ave
- 17018 93rd Ave
- 16813 89th Ave
- 16779 92nd Ave
- 16753 Hilltop Ave
- 16753 91st Ave
- 8750 W 169th St
- 8721 W 169th St
- 17224 Briar Dr
- 16701 Highview Ave
- 9413 Caledonia Dr
- 8710 W 168th St
- 17324 Humber Ln
- 9201 175th St
- 8548 Bethany Ln
- 17533 Pecan Ln
- 9404 Lindsay St
- 9334 Drummond Dr Unit 3
- 9013 Westwood Dr
- 9025 Westwood Dr
- 9007 Westwood Dr
- 9031 Westwood Dr
- 9005 Westwood Dr
- 9037 Westwood Dr
- 9018 Westwood Dr
- 9024 Westwood Dr
- 9012 Westwood Dr
- 9006 Westwood Dr
- 9030 Westwood Dr
- 9101 Westwood Dr
- 9036 Westwood Dr
- 9107 Westwood Dr
- 9001 Westwood Dr
- 17028 Redwood Ct
- 17043 Westwood Dr
- 17020 Redwood Ct
- 9113 Westwood Dr
- 17037 Westwood Dr