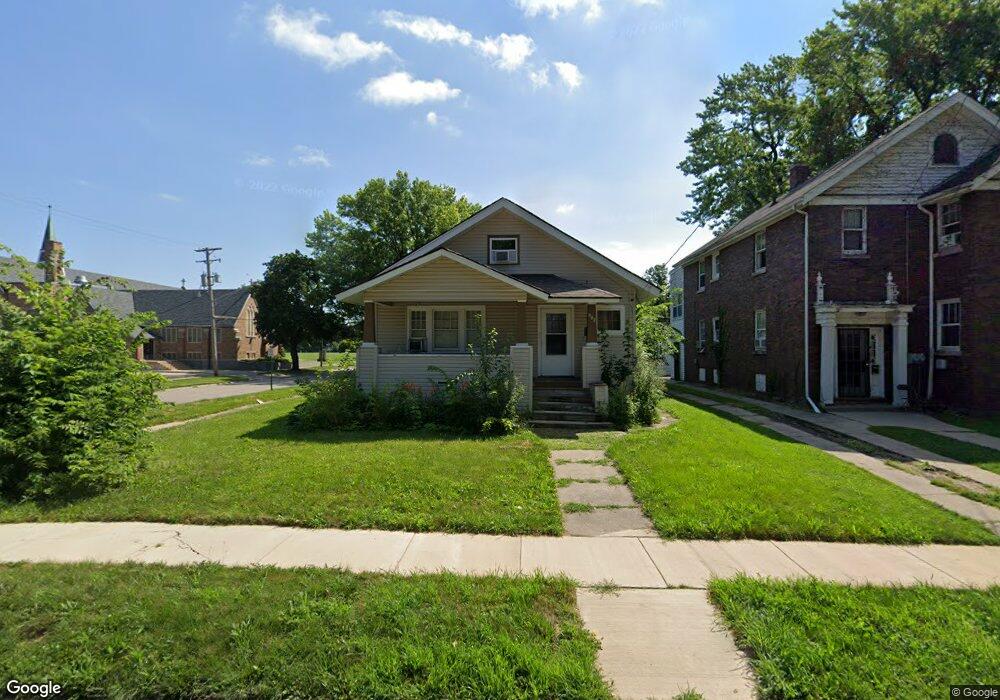
902 15th St Rockford, IL 61104
Keith Creek NeighborhoodEstimated Value: $95,481 - $108,000
2
Beds
1
Bath
900
Sq Ft
$113/Sq Ft
Est. Value
About This Home
This home is located at 902 15th St, Rockford, IL 61104 and is currently estimated at $101,870, approximately $113 per square foot. 902 15th St is a home located in Winnebago County with nearby schools including Constance Lane Elementary School, Abraham Lincoln Middle School, and Rockford East High School.
Ownership History
Date
Name
Owned For
Owner Type
Purchase Details
Closed on
May 5, 2017
Sold by
Mgm & K Dev Inc
Bought by
Williams Roy J
Current Estimated Value
Home Financials for this Owner
Home Financials are based on the most recent Mortgage that was taken out on this home.
Original Mortgage
$36,000
Outstanding Balance
$30,648
Interest Rate
5%
Mortgage Type
New Conventional
Estimated Equity
$71,222
Purchase Details
Closed on
Dec 19, 2011
Bought by
Mgm K Development Inc
Create a Home Valuation Report for This Property
The Home Valuation Report is an in-depth analysis detailing your home's value as well as a comparison with similar homes in the area
Home Values in the Area
Average Home Value in this Area
Purchase History
| Date | Buyer | Sale Price | Title Company |
|---|---|---|---|
| Williams Roy J | $42,000 | Security First Title | |
| Mgm K Development Inc | $8,000 | -- |
Source: Public Records
Mortgage History
| Date | Status | Borrower | Loan Amount |
|---|---|---|---|
| Open | Williams Roy J | $36,000 |
Source: Public Records
Tax History Compared to Growth
Tax History
| Year | Tax Paid | Tax Assessment Tax Assessment Total Assessment is a certain percentage of the fair market value that is determined by local assessors to be the total taxable value of land and additions on the property. | Land | Improvement |
|---|---|---|---|---|
| 2024 | $1,558 | $22,439 | $5,168 | $17,271 |
| 2023 | $1,431 | $19,786 | $4,557 | $15,229 |
| 2022 | $1,335 | $17,685 | $4,073 | $13,612 |
| 2021 | $1,252 | $16,216 | $3,735 | $12,481 |
| 2020 | $1,200 | $15,330 | $3,531 | $11,799 |
| 2019 | $1,154 | $14,611 | $3,365 | $11,246 |
| 2018 | $1,179 | $14,140 | $3,171 | $10,969 |
| 2017 | $2,008 | $13,533 | $3,035 | $10,498 |
| 2016 | $2,006 | $0 | $0 | $0 |
| 2015 | $1,195 | $13,815 | $2,978 | $10,837 |
| 2014 | $1,292 | $15,413 | $3,731 | $11,682 |
Source: Public Records
Map
Nearby Homes