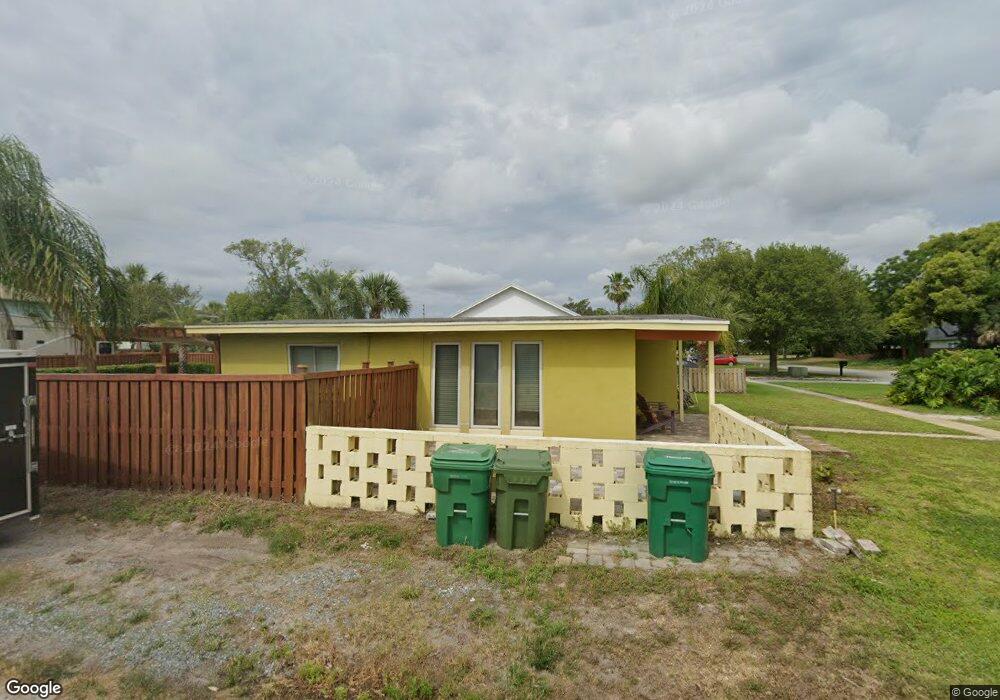
902 9th Ave N Jacksonville Beach, FL 32250
Estimated Value: $479,000 - $587,000
2
Beds
1
Bath
1,025
Sq Ft
$510/Sq Ft
Est. Value
About This Home
This home is located at 902 9th Ave N, Jacksonville Beach, FL 32250 and is currently estimated at $523,161, approximately $510 per square foot. 902 9th Ave N is a home located in Duval County with nearby schools including San Pablo Elementary School, Duncan U. Fletcher Middle School, and Duncan U. Fletcher High School.
Ownership History
Date
Name
Owned For
Owner Type
Purchase Details
Closed on
Jun 20, 2007
Sold by
Gray Kenneth Eugene and Gray Shirley Mae
Bought by
Spiker Ben J and Spiker Debbie D
Current Estimated Value
Home Financials for this Owner
Home Financials are based on the most recent Mortgage that was taken out on this home.
Original Mortgage
$207,100
Outstanding Balance
$128,972
Interest Rate
6.52%
Mortgage Type
Purchase Money Mortgage
Estimated Equity
$394,189
Create a Home Valuation Report for This Property
The Home Valuation Report is an in-depth analysis detailing your home's value as well as a comparison with similar homes in the area
Home Values in the Area
Average Home Value in this Area
Purchase History
| Date | Buyer | Sale Price | Title Company |
|---|---|---|---|
| Spiker Ben J | $218,000 | Watson & Osborne Title Svcs |
Source: Public Records
Mortgage History
| Date | Status | Borrower | Loan Amount |
|---|---|---|---|
| Open | Spiker Ben J | $207,100 |
Source: Public Records
Tax History Compared to Growth
Tax History
| Year | Tax Paid | Tax Assessment Tax Assessment Total Assessment is a certain percentage of the fair market value that is determined by local assessors to be the total taxable value of land and additions on the property. | Land | Improvement |
|---|---|---|---|---|
| 2025 | $2,841 | $200,115 | -- | -- |
| 2024 | $2,751 | $194,476 | -- | -- |
| 2023 | $2,751 | $188,812 | $0 | $0 |
| 2022 | $2,501 | $183,313 | $0 | $0 |
| 2021 | $2,455 | $176,869 | $0 | $0 |
| 2020 | $2,426 | $174,428 | $0 | $0 |
| 2019 | $2,391 | $170,507 | $0 | $0 |
| 2018 | $2,355 | $167,328 | $0 | $0 |
| 2017 | $2,319 | $163,887 | $0 | $0 |
| 2016 | $2,277 | $160,517 | $0 | $0 |
| 2015 | $2,311 | $159,402 | $0 | $0 |
| 2014 | $2,324 | $158,137 | $0 | $0 |
Source: Public Records
Map
Nearby Homes